In the "Charts" frame the user can use "Comma shortcuts" for changing chart resolutions. After each shortcut, the user should press the <Enter> key to change the chart. The "Comma shortcuts" are the following:
| ,D | Daily chart |
| ,W | Weekly chart |
| ,M | Monthly chart |
| ,Q | Quaterly chart |
| ,In | Intraday chart, where "n" is the number of minutes per bar/candle |
| ,T | Tick chart |
| ,Tn | Constant Tick chart, where "n" is the number of ticks per bar/candle |
| ,Vn | Volume chart, where "n" is the number of contracts per bar/candle |
For example:
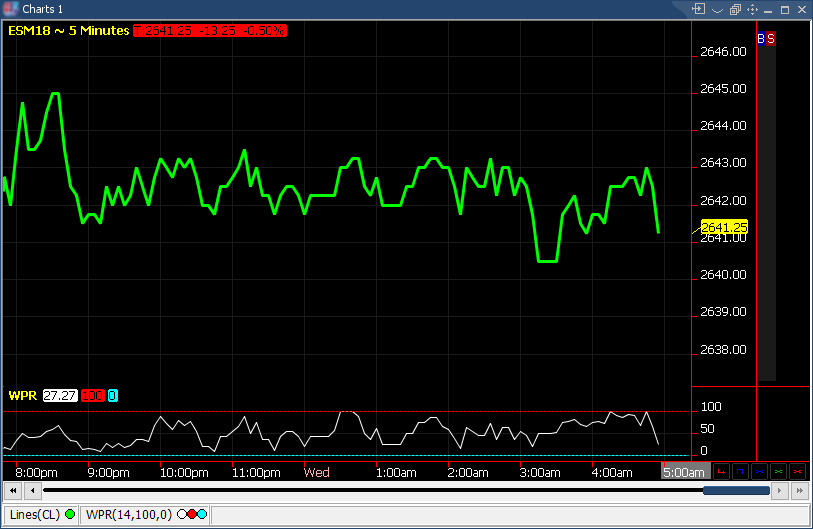
For example, to change from the current resolution to a 5 minute chart, the user will type: ,I5<Enter>. Once the chart is an Intraday chart, the user can change to different minutely resolutions simply by typing: , plus the number of minutes per bar plus <Enter>. For example, if he wants to change his chart to a 3 minute chart, he will type: ,3<Enter>. If he next wants to change to a Constant Tick chart of 5 ticks per bar/candle, he will type: ,T5<Enter>. If he subsequently wants to change to a Constant Tick chart of 10 ticks, he will type: ,10<Enter>.
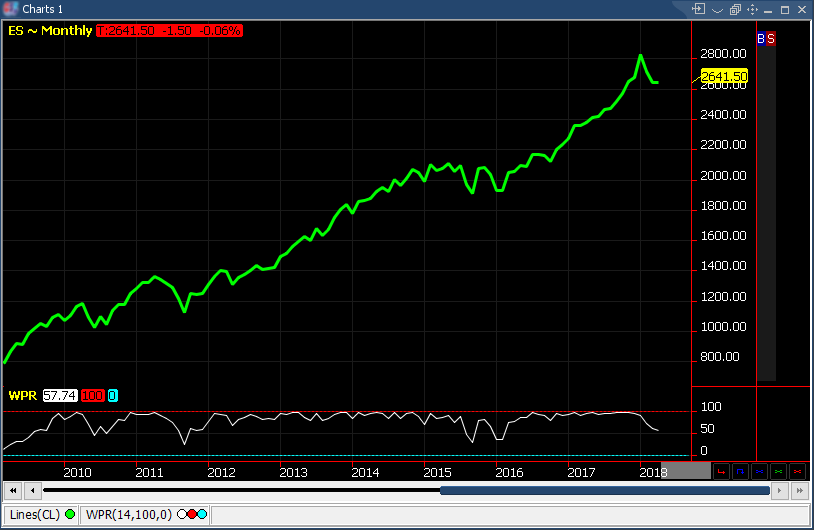
In the first screenshot below, you can see a Daily chart for ESZ07. If you press the ,M<Enter> "Comma shortcut", the second chart will appear, which will be a Monthly chart.
|
|
|
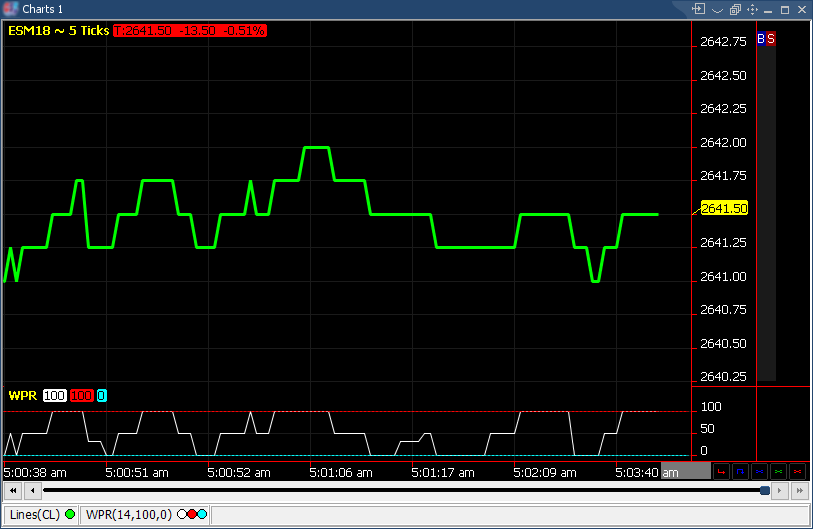
If you next want to change to a Constant Tick chart of 5 ticks per bar/candle, type: ,T5<Enter>. After these, the following chart will appear:
|
