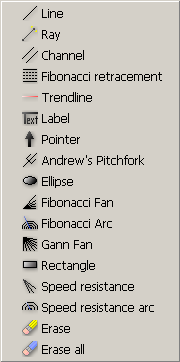
The fourth sub-menu in "Spread Charts" toolbar is "Charts Tools" and its components are the following:
Line, Ray, Channel, Ray, Fibonacci retracement, Trendline, Label, Pointer, Andrew's Pitchfork, Ellipse, Fibonacci Fan, Fibonacci Arc, Gann Fan, Rectangle, Speed resistance, Speed resistance arc, Erase and Erase all.
|
|
To use a tool click one of the tool buttons, for example line button. If you set some properties for this tool those settings will remain the same when you re-use this tool at a later time. If you want to draw using another tool you simply click on the appropriate button for that tool.
The settings for a given tool from a chart remain the same until a new chart is created over the old chart. When this occurs the tools settings will also be deleted (all the tool generated output will be deleted). If the session is closed and opened again the settings will remain unchanged. This will not affect the tools.
To change the properties for a object (line, channel, ...) use right click on the object. Using drag-and-drop you can move the object anywhere you want on the chart.

 Line
Line
To draw a line, first make sure the tool button is selected, then click somewhere in the chart and a point will be placed there. Keep the mouse button pressed and move the cursor on the chart. A line will appear. You can change the direction of the line by moving the cursor. When you release the mouse button the line will remain on the chart.
|
To set some properties for a line click the line. The line will appear as selected. You can change the dimension and placement of line by clicking on one of the 2 points that appear on the line and moving that point somewhere on the chart. If you want to change the other properties of the line do a right click on the line. The "Line Properties" dialog will appear on the screen.

|
The properties for a line:
|
- Line Weight: is the thickness of the line, this can be 1, 2, 3, 4 or 5 - Line Style: this can be continuous or interrupted - Line Color: is the color of the line |
 Ray
Ray
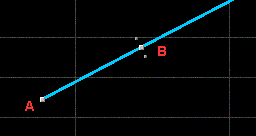
Ray has two "sensitive points" (A and B in the figure). To draw a Ray, first make sure the tool button is selected, then click somewhere on the chart to draw the A point, then drag the mouse cursor for the B point and release the mouse button. After the Ray is finished you can adjust the location of the "sensitive points", to do this click on the sensitive point and drag and drop the point to another location.
|
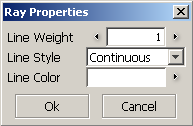
To change the properties of Ray do a right click on the tool. The "Ray Properties" dialog will appear on the screen.
|
The properties for Ray:
|
- Line Weight: is the thickness of the line, this can be 1, 2, 3, 4 or 5 - Line Style: this can be continuous or interrupted - Line Color: is the color of the line |
 Snap mode
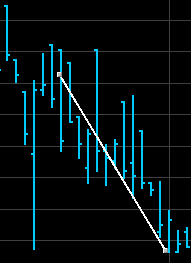
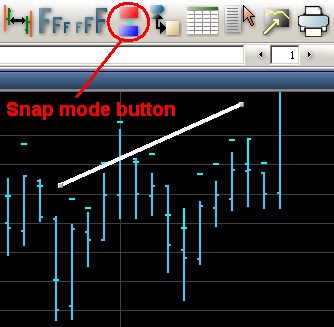
Snapping mode is active when a line is drawn (see the first figure below). This mode has two phases:
translation and rotation. After "Snap Mode" button is pressed
( ),
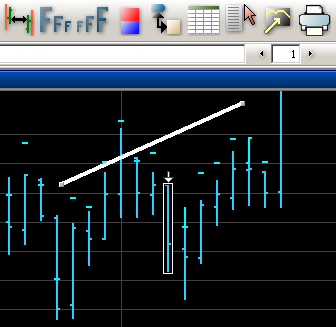
select the snap point which can be the H, L, O, C of a chart point (see
the second figure below) and adjust the
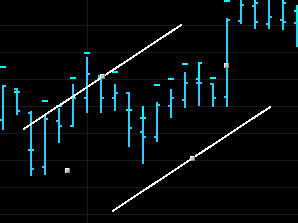
line position to the user's need (see the third figure below). When you are
in "Snap Mode" the "Snap Mode" button is
),
select the snap point which can be the H, L, O, C of a chart point (see
the second figure below) and adjust the
line position to the user's need (see the third figure below). When you are
in "Snap Mode" the "Snap Mode" button is
 .
.
|
|

|
 Channel
To draw a channel, first make sure the tool button is selected, then click somewhere in the chart and a point will be placed there. Keep the mouse button pressed and move the cursor on the chart. A line will appear. You can change the direction of line by moving the cursor. If you release the mouse button the line will remain on the chart and another line attached on mouse will appear. This line is parallel with first line. If you click somewhere on the chart, this line will be placed there. The channel is complete.
|
To set some properties for a channel click it. The channel will appear as selected. You can change the dimension and placement of channel by clicking on one of the 4 points that appear on the channel. Moving that point somewhere on the chart you can change the dimension and the placement of channel. If you want to change the other properties of the channel do a right click on the channel. The "Channel Properties" dialog will appear on the screen.
|
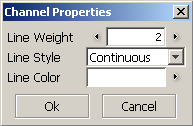
The properties for a channel:
|
- Line Weight: is the thickness of the line, this can be 1, 2, 3, 4 or 5 - Line Style: this can be continuous or interrupted - Line Color: is simply the color of the two lines of channel |
 Fibonacci retracement
To draw a Fibonacci, first make sure the tool button is selected, then click somewhere in the chart and a point will be placed there. Keep the mouse button pressed and move the cursor on the chart. A line, parallel with the time coordinate, will appear. You can change the direction of line by moving the cursor. If you release the mouse button the line will remain on the chart and another line attached on mouse will appear. This line is parallel with first line. If you click somewhere on the chart, this line will be placed there. Computer will draw automatically another 3 lines in the middle. The middle line is at 50% between the first two lines. The upper line is with 12% upper than the middle line and the lower line is 12% lower.
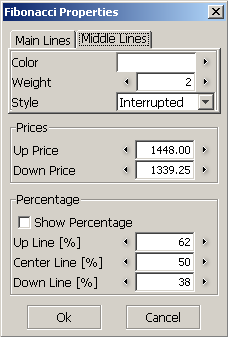
To set some properties for the Fibonacci just click it. The Fibonacci will appear as selected. You can change the dimension and placement of Fibonacci by clicking on one of the 4 points that appear on the Fibonacci and moving that point somewhere on the chart. If you want to change the other properties of Fibonacci do a right click on the tool. The "Fibonacci Properties" dialog will appear on the screen. The properties dialog contains two tabs: "Main Lines" and "Middle Lines". The "Main Lines" refers to the two main lines of Fibonacci and the "Middle Lines" refers to the three lines that are between these two.

|
|
|
The properties for "Main Lines" and "Middle Lines":
The properties for Fibonacci:
|
|
 Trendline
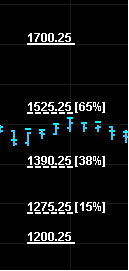
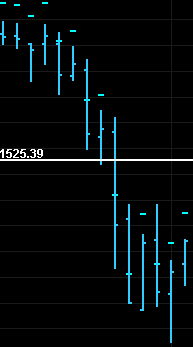
Trendline is different than the others tools in the sense that it's parallel with time axis and it's expanding on the entire graphic. To draw this line, first make sure the tool button is selected, then click somewhere on the chart and the line will be placed there. To every trend line corresponds a price.
|
To change the position of the trend line just move the line up or down with the mouse.
If you want to change the properties of the trendline do a right click on it. The "Trend Line Properties" dialog will appear on the screen.
|
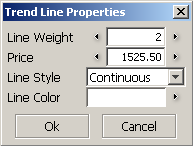
The properties for a trend line:
|
- Line Weight: is the thickness of the line, this can be 1, 2, 3, 4 or 5 - Price: this is the price that corresponds to the position of trend line - Line Style: this can be continuous or interrupted - Line Color: is simply the color of the two lines of channel |
 Label
Label
To draw a label on the graphic, first make sure the tool button is selected, then click somewhere in the chart and a point will be placed there. Keep the mouse button pressed and move the cursor on the chart. An arrow will appear. You can change the direction of the arrow by moving the cursor. If you release the mouse button the arrow will remain on the chart. The "Label Properties" dialog will be automatically opened.
|
|
|
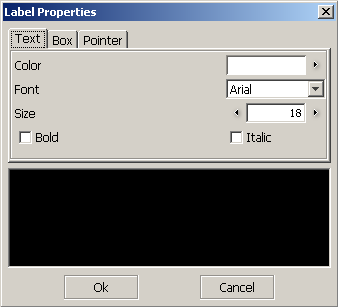
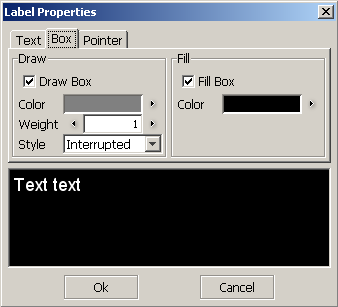
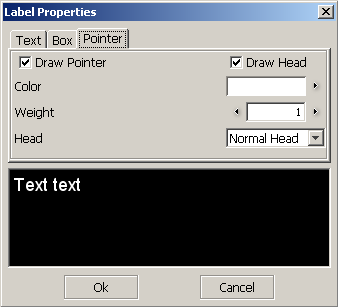
"Label Properties" dialog has three sections:
|
- Text: contains the following text properties: Color, Font, Size, Bold, Italic - Box: the label can be drawn in a box. This section contains two fields:
|
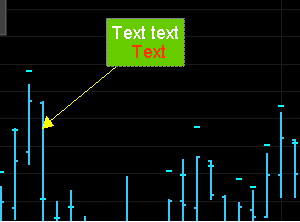
In the figure below you can see a formatted label.
|
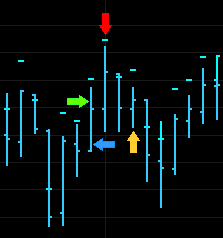
 Pointer
To draw a pointer, first make sure the tool button is selected, then click somewhere on the graphic and the pointer will be placed there.
|
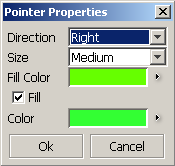
To change the properties of the pointer do a right click on the tool. The "Pointer Properties" dialog will appear on the screen.
|
The properties for a pointer:
|
- Direction: this is the direction of pointer (Left, Right, Up or Down) - Size: the size of pointer can be Small, Medium or Large - Fill Color: the color that pointer will be filled if the fill option was chosen - Fill: if this option is selected the pointer will be filled with a color - Color: is the color of pointer |
 Andrew's Pitchfork
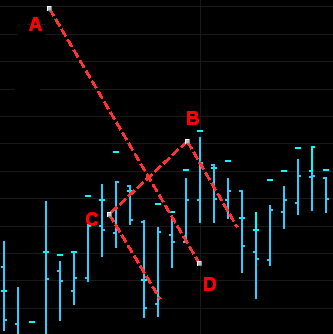
Andrew's Pitchfork has 4 "sensitive points" (A, B, C and D in the figure). To draw a Andrew's Pitchfork, first make sure the tool button is selected, then click somewhere on the chart to draw the A point, then move the mouse cursor for the B point and click there, do the same for C and D points. After the Andrew Pitchfork is finished you can adjust the location of the "sensitive points", to do this click on the sensitive point and drag and drop the point to another location. The A, B and C points can be moved anywhere on the chart. The D is limited by the first three points.
|
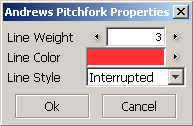
To change the properties of Andrew's Pitchfork do a right click on the tool. The "Andrew's Pitchfork Properties" dialog will appear on the screen.
|
The properties for Andrew's Pitchfork:
|
- Line Weight: is the thickness of the line, this can be 1, 2, 3, 4 or 5 - Line Color: is the color of Andrew Pitchfork - Line Style: this can be continuous or interrupted |
 Ellipse
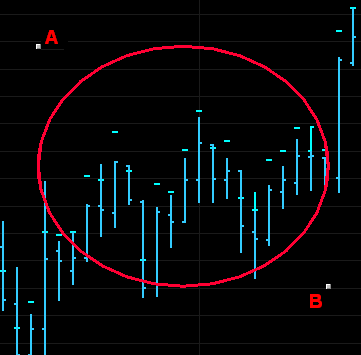
Ellipse has two "sensitive points" (A and B in the figure). To draw the ellipse, first make sure the tool button is selected, then click somewhere on the chart to draw the A point, then drag the mouse cursor for the B point and release the mouse button. After the ellipse is finished you can adjust the location of the "sensitive points", to do this click on the sensitive point and drag and drop the point to another location.
|
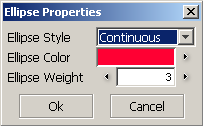
To change the properties of the ellipse do a right click on the tool. The "Ellipse Properties" dialog will appear on the screen.
|
The properties for the ellipse:
|
- Ellipse Style: this can be continuous or interrupted - Ellipse Color: is simply the color of the ellipse - Ellipse Weight: is the thickness of the ellipse, this can be 1, 2, 3, 4 or 5 |
 Fibonacci Fan
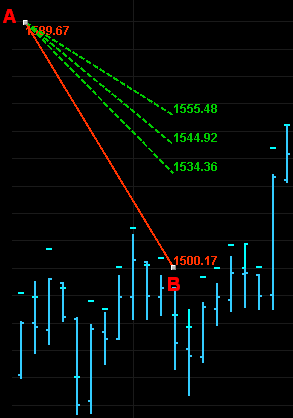
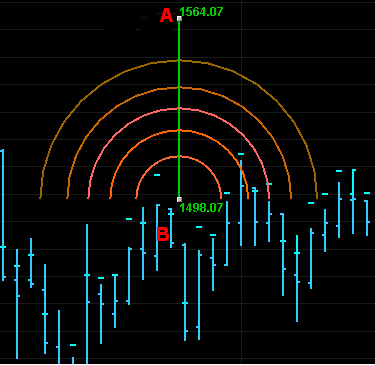
Fibonacci Fan has two "sensitive points" (A and B in the figure). To draw a Fibonacci Fan, first make sure the tool button is selected, then click somewhere on the chart to draw the A point, then drag the mouse cursor for the B point and release the mouse button. After the Fibonacci Fan is finished you can adjust the location of the "sensitive points", to do this click on the sensitive point and drag and drop the point to another location.
|
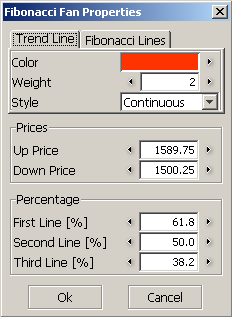
To change the properties of Fibonacci Fan do a right click on the tool. The "Fibonacci Fan Properties" dialog will appear on the screen.
|
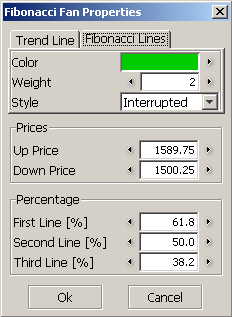
|
The properties for Fibonacci Fan:
- Trend Line:
|
 Fibonacci Arc
Fibonacci Arc has two "sensitive points" (A and B in the figure). To draw a Fibonacci Arc, first make sure the tool button is selected, then click somewhere on the chart to draw the A point, then drag the mouse cursor for the B point and release the mouse button. After the Fibonacci Arc is finished you can adjust the location of the sensitive points, to do this click on the "sensitive point" and drag and drop the point to another location.
|
To change the properties of Fibonacci Arc do a right click on the tool. The "Fibonacci Arc Properties" dialog will appear on the screen.
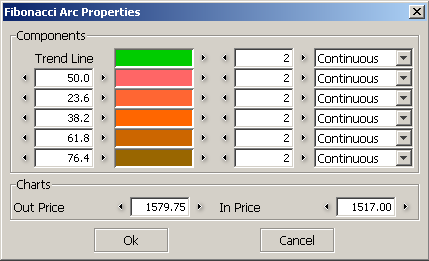
|
The properties for Fibonacci Arc: The first column contains the values of arcs in percent. The second column contains the color for trend line and the colors for each arc. The third column contains the thickness of trend line and the thickness of each arc. The last column contains the line style for trend line and for each arc.
 Gann Fan
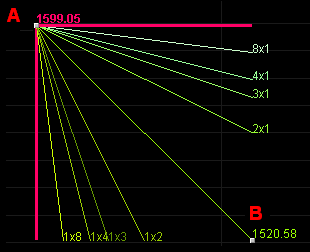
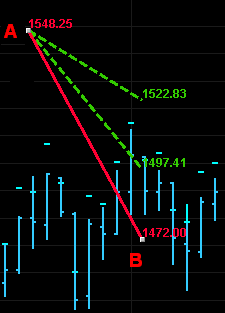
Gann Fan has two "sensitive points" (A and B in the figure). To draw a Gann Fan, first make sure the tool button is selected, then click somewhere on the chart to draw the A point, then drag the mouse cursor for the B point and release the mouse button. After the Gann Fan is finished you can adjust the location of the sensitive points, to do this click on the "sensitive point" and drag and drop the point to another location.
|
To change the properties of Gann Fan do a right click on the tool. The "Gann Fan Properties" dialog will appear on the screen.
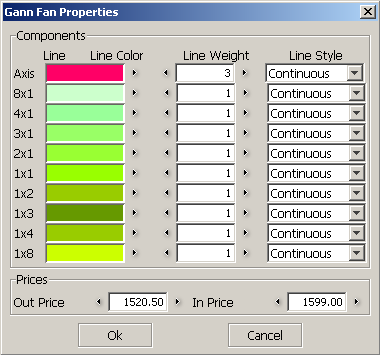
|
You can set different properties for each line in the Gann Fan:
|
- Line Color: is the color of line - Line Weight: is the thickness of the line, this can be 1, 2, 3, 4 or 5 - Line Style: the line style can be continuous or interrupted |
 Rectangle
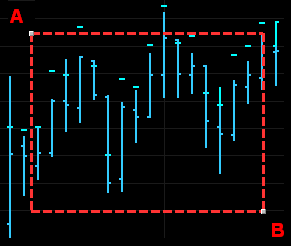
Rectangle has two "sensitive points" (A and B in the figure). To draw a rectangle, first make sure the tool button is selected, then click somewhere on the chart to draw the A point, then drag the mouse cursor for the B point and release the mouse button. After the rectangle is finished you can adjust the location of the "sensitive points", to do this click on the sensitive point and drag and drop the point to another location.
|
To change the properties of the rectangle do a right click on the tool. The "Rectangle Properties" dialog will appear on the screen.
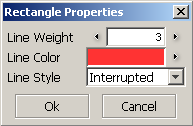
|
The properties for rectangle:
|
- Line Weight: is the thickness of the rectangle, this can be 1, 2, 3, 4 or 5 - Line Color: is the color of rectangle - Line Style: this can be continuous or interrupted |
 Speed resistance
Speed resistance has two "sensitive points" (A and B in the figure). To draw a Speed resistance, first make sure the tool button is selected, then click somewhere on the chart to draw the A point, then drag the mouse cursor for the B point and release the mouse button. After the Speed Resistance Fan is finished you can adjust the location of the "sensitive points", to do this click on the sensitive point and drag and drop the point to another location.
|
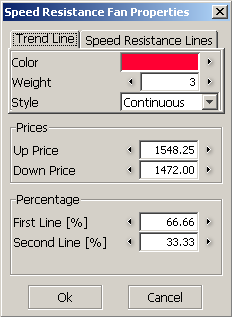
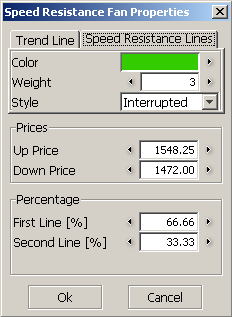
To change the properties of Speed Resistance Fan do a right click on the tool. The "Speed Resistance Fan Properties" dialog will appear on the screen.
|
|
The properties for Speed Resistance Fan:
- Trend Line:
- Down Price: is the price that corresponds to the B point |
 Speed resistance arc
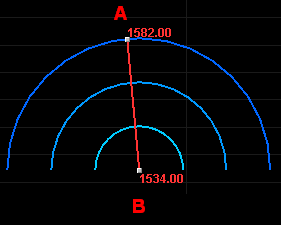
Speed Resistance Arc has two "sensitive points" (A and B in the figure). To draw a Speed Resistance Arc, first make sure the tool button is selected, then click somewhere on the chart to draw the A point, then drag the mouse cursor for the B point and release the mouse button. After the Speed Resistance Arc is finished you can adjust the location of the "sensitive points", to do this click on the sensitive point and drag and drop the point to another location.
|
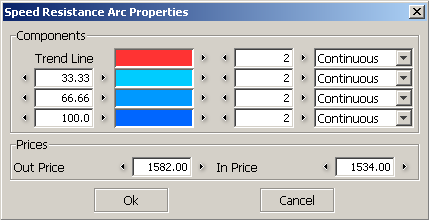
To change the properties of Speed Resistance Arc do a right click on the tool. The "Speed Resistance Arc Properties" dialog will appear on the screen.
|
The Speed Resistance Arc is similar with Fibonacci Arc, the difference is that Fibonacci Arc has five arcs and Speed Resistance Arc has only three.
 Erase
Erase
This button is used when you want to delete an object from chart. You click on the object and then press this button. The object will be deleted.
 Erase all
By pressing this button you will delete all the objects from the chart.