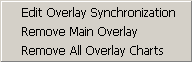
The second sub-menu in "Spread Charts" toolbar is "Overlay Charts" and its components are represented in the figure below.
|
|
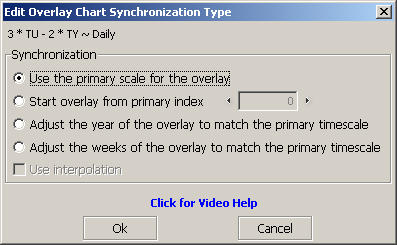
If you click this option the "Edit Overlay Chart Synchronization Type" dialog appears. See the figure below.
|
In this dialog box, if the first option ("Use the primary scale for the overlay") is selected, the overlay chart and the primary chart share the same timescale. The "Start overlay from primary index" displays the overlay charts points starting at a certain index on the primary chart points vector. The third option ("Adjust the year of the overlay to match the primary timescale") overlay a chart matching: day/month of both charts points. For E.g. primary chart ECM7 and overlay ECM5, then if primary point is 6/24/2007 the overlay point will be 6/24/2005. The last option is "Adjust the weeks of the overlay to match the primary timescale" match the trading weeks of both contracts.
You can "Use interpolation" whether you select "Adjust the year of the overlay to match the primary timescale" or "Adjust the weeks of the overlay to match the primary timescale".
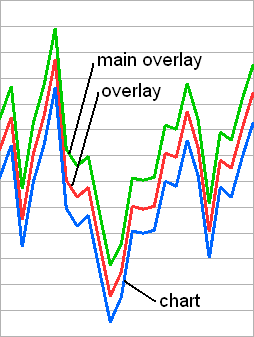
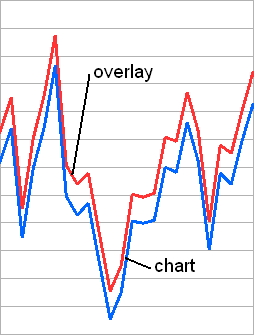
This option removes the main overlay chart. See the pictures below.
|
|
This option removes all the overlay charts inserted before. See the pictures below.
|
|

|
