 Spread Charts Properties
Spread Charts Properties
Spread Charts Properties
Properties dialog for "Spread Charts" contains the following sections: Settings, Advanced and Overlay.
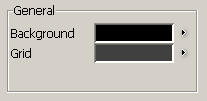
- Background - the background color of the spread chart. To choose a color press the button from the right side
of the field  - Grid - the color of the grid lines in the chart. To choose a color press the button from the right side of the field |
|
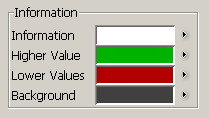
This settings refers to info box:
|
- Information - the color of text from info box - Higher Value - the color of text from info box for higher values - Lower Values - the color of text form info box for lower values - Background - the color of background for info box |
|
|
- Values - the color of the price values - Scale - the color of Values Scale |

|
|
- Values - the color of time values - Scale - the color of Time Scale - Special Values - the color of the "special" time values as "Nov" or "Tue" for example - Special Scale - the color of Time Scale for special values |

|
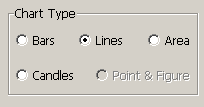
Here you can choose a chart type and change it's settings. The chart types used in this application are:
|
- Bars - reveals the information about the close, high, low and open price - Lines - a simple line drowned from one price to another. This chart offers the information only for one price. You can choose that price from Lines Properties - Area - it's similar with line chart. The difference is that the area chart is filled - Candles - contains the same information as bar charts - Points & Figure - a series of X's and O's that indicates the up trends and down trends |
|
|
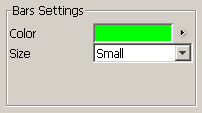
- Color - the color of the bars - Size: - it can be "Small" or "Large". This refers to the size of bars |
|
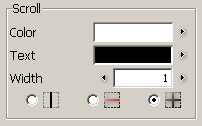
Here, you can establish the width of the lines that appear while you hover over the chart with the left mouse button pressed.
|
- Color - you can set the color of the lines - Text - you can set the color of the text that is written in the box that appears on the values scale and the time scale - Width - you can set the width of the lines (pixels) - You can also select wich line to appear: vertical, horizontal or both |
|
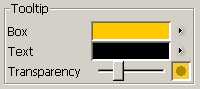
Here, you can establish the look of the tooltip box.
|
- Box - the background color of the tooltip box. To choose a color press the button from the right
side of the field - Text - the color of the text displayed in the tooltip box. To choose a color press the button from the right side of the field - Transparency - using the slider, you can choose a level of transparency of the tooltip box. The small box on the right of this slider can help you decide of how the tooltip box will look like |
|
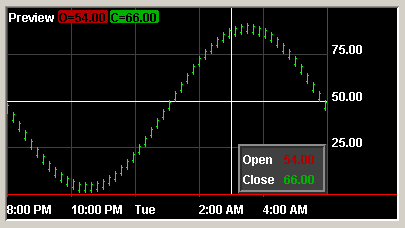
The "Preview" of the chart shows the modifications which you made in this dialog box.
|

Here you can set the size of the Scales Font manually or it can be set to auto adjust.

|
Here you can set the Scroll Outline.

|
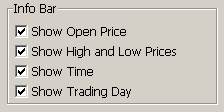
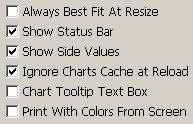
Here you can choose what information will be shown in the Info Bar.
|
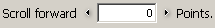
This will scroll the chart forward with the number of points you specified. This feature can be used when you want to draw some trends for the last points of the chart and it goes out of the chart area.
|
Here you can choose setup more advanced options.
|
Here you can set the size of the Font for the "Info Bar".

|
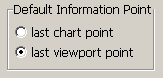
This refers to the information from info box in the situation that there is no chart point selected. The information will be taken from the last chart point or last viewport point. The viewport if that section of the chart that you see on the screen at a time, when you scroll the chart the viewport changes.
|
The "Preview" of the chart shows the modifications which you made in this dialog box.

|
Here you can set the color for the overlay charts. The colors which were selected are shown in the
"Preview" box. If you need more then 5 overlay chart, you can add by pressing the
"Add Overlay" button. If you want to delete the settings for an overlay chart, you
have to press the "Delete Overlay" button.
The color of the overlay chart can be selected from the "Choose The
Color" dialog box by pressing the
button.

|

|
| "Apply" button - this will change the previous setting with the actual settings "Apply to All" button - the settings will be applied to all existing frames "Default for New" button - the settings will be set as default for any new frames opened "Cancel" button - the change in setting will be ignored |