There are two main tabs: "Indicators" and "Functions". The first one contains a list of all custom indicators and for selected indicator: a list with all components and a list with all properties. The second tab contains a list of all custom functions, a list of default functions and a list of all built-in functions.
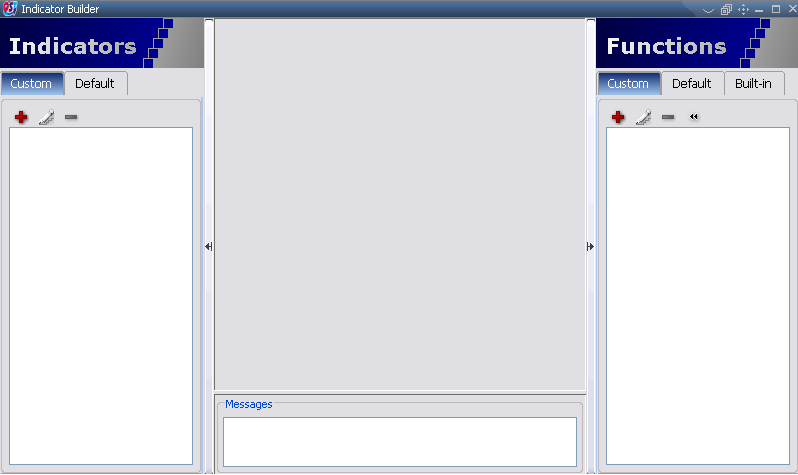 |
If you want to edit/view a custom function, built-in function, default function or an indicator, a new tab will appear on the screen containing the formulas for that function or indicator. The tabs are color coded: an indicator tab will be blue, a custom function tab and default function tab will be green and a built-in function tab will be gray.
|
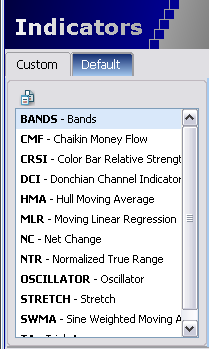
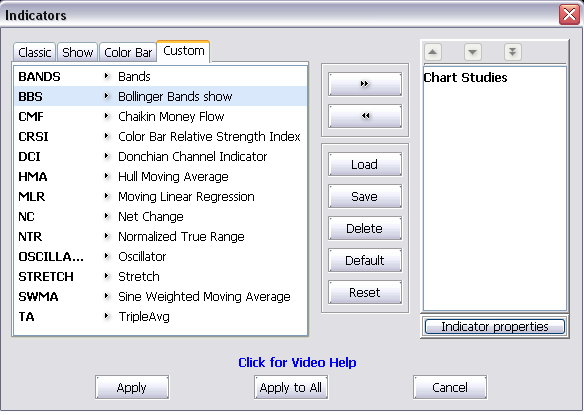
To create a new indicator you have to click on "New Indicator" button from the "Custom" tab of the "Indicators" section. You can also click on the "Default" to add a pre-defined indicator from the given list. 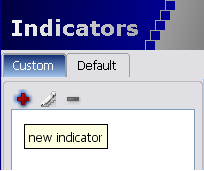 |
 |
|
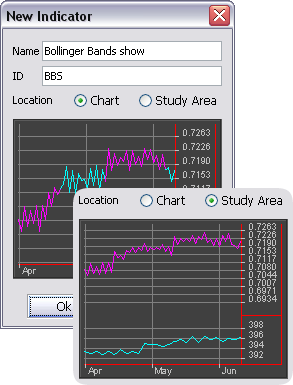
The "New Indicator" dialog will be shown. You have to write the id and name for the new indicator. As an example, we will try to create the Bollinger Bands indicator - we'll type the "BBS" as id and "Bollinger Bands show" as name. If "Chart" is selected, the indicator will be placed over the chart; otherwise it will be placed in a new study area, below the chart. If you agree, then press "Ok" button. |
 |
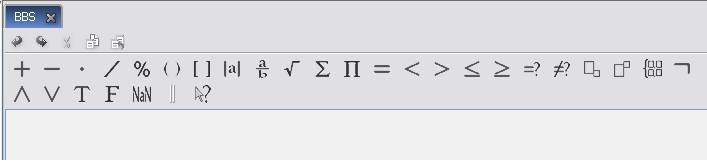
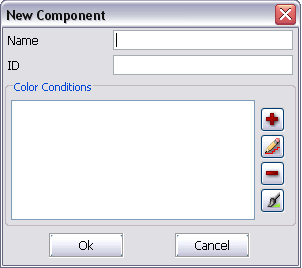
A new blue tab having the indicator’s id (e.g., "BBS") will appear. To enable the math editor pane, please add a component. Here you have to write the formula(s) used in the computations. You must have at least 1 component for a new indicator.
 |
  |
To start a comment row you have to write "//" at the beginning of a new row.
To write summation, square root and other symbols you have to press a button from the math symbols toolbar.
 |
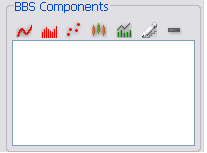
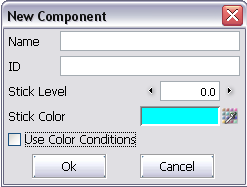
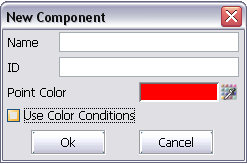
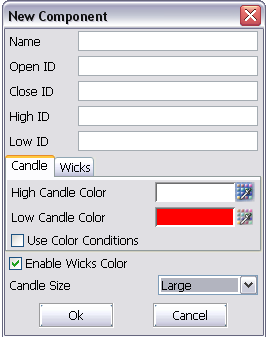
Now, you have to define the indicator’s components. There are several kinds of components: Line Component, Stick Component, Point Component, Candle Component and Chart Dataview Component.
     |
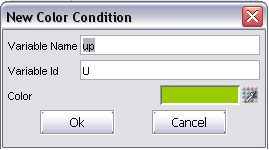
You can define color conditions for any type of component (dataview type components use color conditions only) by enabling the "Use Color Conditions" checkbox.
You can create several variables and set their color.
 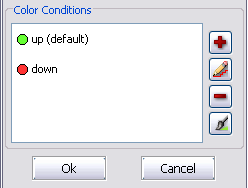 |
After creating the variables, make sure that you add the conditions for the variables while defining your indicator. Here is an example:
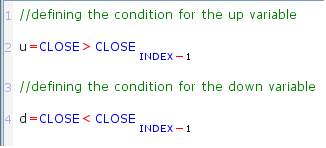 |
For Bollinger Bands we will add
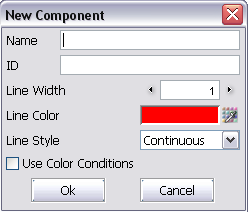
two line components called Upper Band (UB) and Lower Band (UB). To add the first component
will press the "new line component"  button.
Then a dialog will appear on the screen:
button.
Then a dialog will appear on the screen:
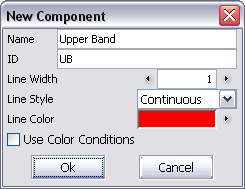 |
We'll write "UB" as id and "Upper Band" as name, the color will be red, the thickness of line will be 1 pixel and the line will be continuous. Then we'll press “Ok” button. The first component is created; the second component will be created the same way.
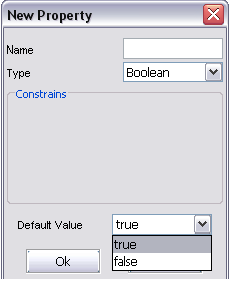
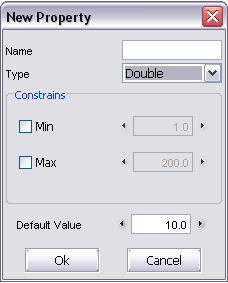
Next you can define the indicator’s properties. This is optional. For a new property, you can customize the name, type, contrains and default value. There are 4 types of properties: Boolean, Integer, Double and Price. For Integer and Double, you can define the Min and Max contrains, and the default numeric value. For boolean, you simply choose the default value to be True or False. For Price type properties, you can check/ uncheck the values it can take under the Contrains section, and choose which one of them will be the default value.
 |
    |
In our example, we have to define a property called "Price" and a property called "Length".
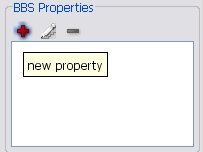
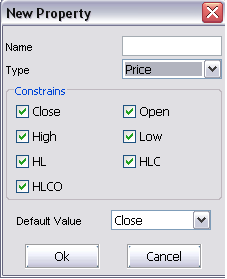
To create the "Price" property we will press the "new property" button. A dialog will appear on the screen:
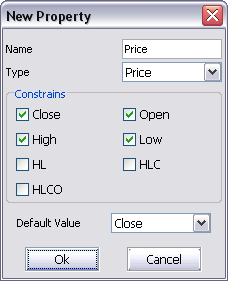 |
We'll write the name of property "Price", then will select the property type "Price". We will select only the "Close", "Open", "High" and "Low" for the constrains – the user can choose only one of these values for the price when we'll use this indicator. At the end you can select a default value and press "Ok" button.
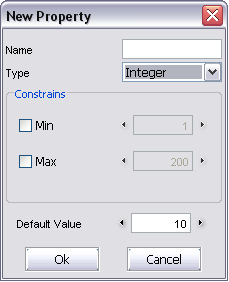
To create the "Length" property we will press the "new property" button. The same dialog will appear on the screen:
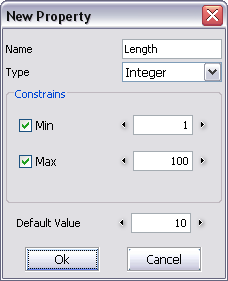 |
Will write "Length" as name, the Length refers to the number of points used in the computation, so it is an "Integer" property. For constrains section will choose the minimum of 1 and maximum of 100. If we don’t choose the minimum and maximum values, there will be no minimum or maximum limitations. At the end we can choose the default value then press "Ok" button.
Last, but not least, you have to define the formulas for the indicator. In our case, for Bollinger Bands, the formulas would be the following:
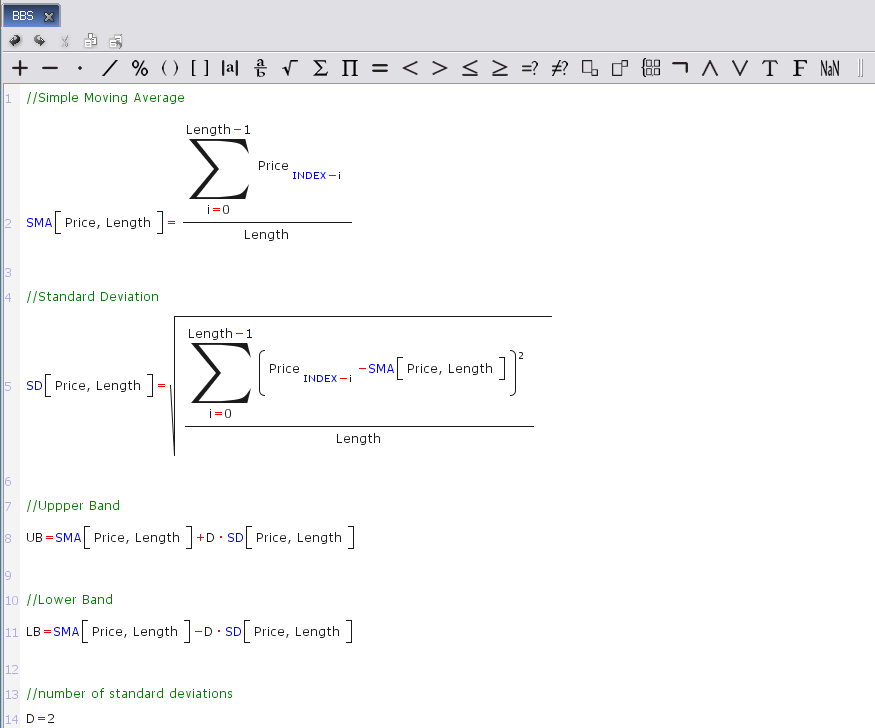 |
INDEX refers to the value of the price in the current point.
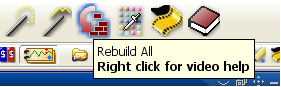
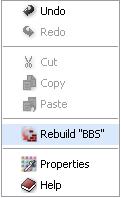
| Now, the indicator is finished. Don’t forget to press "Rebuild All" button; it
will save the content of all open tabs. You can also right click inside a tab and select the "Rebuild" option.
|
 |
Once an indicator is created, you can drag and drop it from your Indicator Builder workspace directly to any open chart and it will be applied immediately. Another way to add is by opening the Indicator list (Alt+I) from a chart, and selecting your indicator from the "Custom" tab.
 |
You don’t have to rewrite functions each time when you write an indicator. You can use the built-in functions from its respective tab in the Functions section. Using the built-in functions, all that you have to write for the Bollinger Bands is:
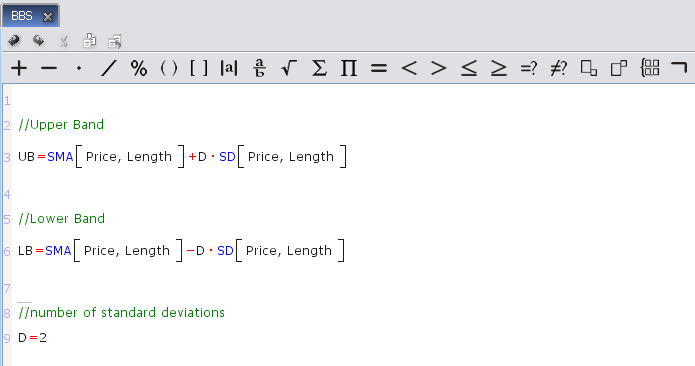 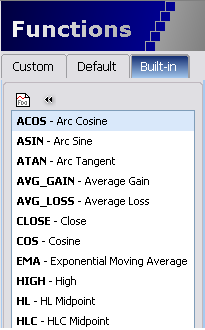 |
If you rewrite a function, the local function will override the built-in or custom function. For instance, if you rewrite the SD function as local function, the local SD function will override the built-in SD function.
| In the "Default" tab, you can find a list of pre-defined functions, similar to the built-in functions, such as Double Exponential Moving Average (DEMA), Summation (SUM) and Triple Exponential Moving Average (TEMA). They are displayed with their complete formulas, so you can insert them into your indicator definition. | 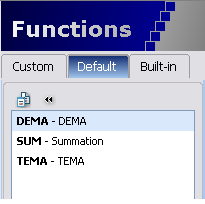 |
If you want to use a function in more than one indicator and you don’t have that function as a built-in function, you will have to define a custom function.
|
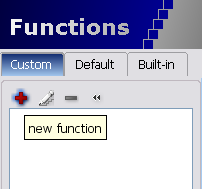
If you want to use a function in more than one indicator and you don’t have that function as a built-in function, you will have to define a custom function. In order to do that, go to the "Custom" tab of the "Functions" section and press the "New Function" button. |
 |
Just for this example will consider that we don’t have the SD function in the list of built-in functions. We will try to define a custom SD function so we can use it in the Bollinger Bands indicator.
We will create a new function The following dialog will appear on the screen:
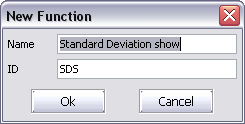 |
Will write the "SDS" as id and "Standard Deviation show" as name then will press "Ok" button. A new green tab will appear, having the functions id (e.g., "SDS"):
 |
We will write the function’s formula; the function is finished.
Once the function is defined, it can be use the same as a built-in function.
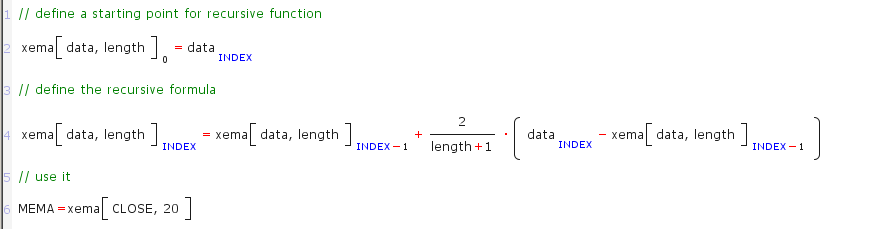
Here are some other examples for other function formulas. You can use recursive functions:
 |
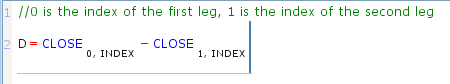
When defining an indicator for a spread, you can mark the values for each leg separately, as in the example below:
 |