 Bollinger Bands %
Bollinger Bands %
Bollinger Bands %
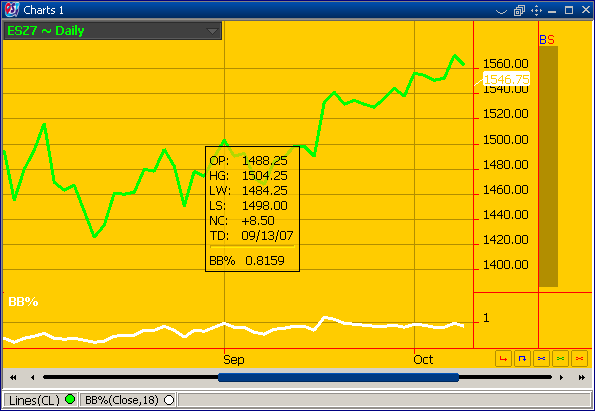
"Bollinger Bands %" has two bands plotted around a moving average using the value of standard deviation. An indicator derived from "Bollinger Bands" that we call "Bollinger Bands %" can be of great help, using the same formula that George Lane used for stochastics. The indicator "Bollinger Bands %" tells us where we are within the bands.
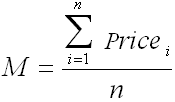
First the Moving Average of prices is calculated. This is a Simple Moving Average.
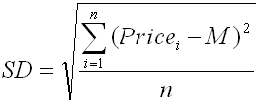
Than the Standard Deviation is calculated by using the following formula:
After these, the "Upper Bollinger Band" and the "Lower Bollinger Band" can be calculated by using the following formulas:
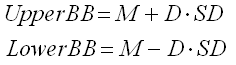
where:
|
"Price" can be: Close, Open, High, Low, HL MidPoint, HLC MidPoint or HLCO MidPoint and "D" is the number of standard deviations (two deviations) |
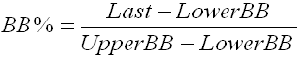
Finally, we can calculate the "Bollinger Bands %" by using the following formula:
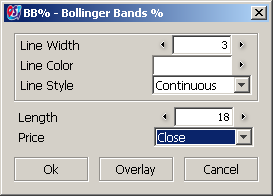
From "Indicator Properties" you can change the settings for indicator:
|
In this dialog box, the user can set the line thickness, color and style. The "Price" used in the construction of indicator can be: Close, Open, High, Low, HL MidPoint, HLC MidPoint or HLCO MidPoint. From "Length" you can change the number of points that are used in the moving average.
|
