 Envelopes
Envelopes
Envelopes
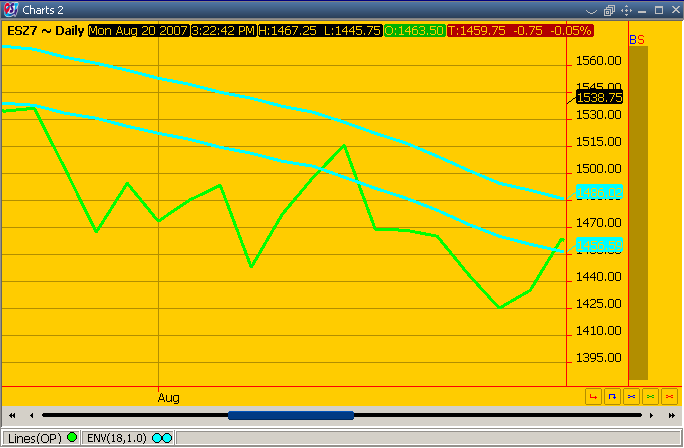
"Envelopes" are very similar with Bollinger Bands. There are two bands plotted around a moving average using the value of a fixed percentage of moving average.
First, the Moving Average is calculated:

Then the value of "Upper Band" (UB) and "Lower Band" (LB) is calculated:
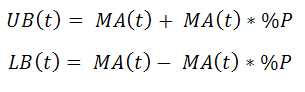
where:
|
"P(n)" is the price for the current interval, which can be: Close, Open, High,
Low, HL MidPoint, HLC MidPoint, HLCO Midpoint
or Average "n" is the number of chart points used in the calculation of moving average. The period of time is given as number chart points and is called "Length" "MA(t)" is the moving average for the current interval. This can be SMA or EMA "%P" is the percentage value for the price band |
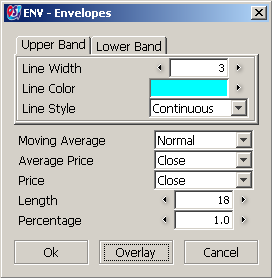
From "Indicator Properties" you can change the settings for indicator:
 |
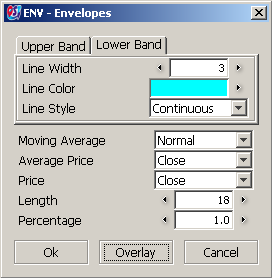 |
This dialog has two sections: "Upper Band" and "Lower Band" from where you can set line color, thickness and style for upper band and lower band. The price used in the construction of indicator can be: Close, Open, High, Low, HL MidPoint, HLC MidPoint, HLCO MidPoint or Average. The "Moving Average" can be "Normal" (SMA) or "Exponential" (EMA). If the "Price" is Average you can choose the price used in the calculation of this price from "Average Price", this can be Close, Open, High, Low, HL MidPoint, HLC MidPoint or HLCO MidPoint. From "Length" you can change the number of points that are used in the moving average. The upper band and lower band are shifted up respectively down from the moving average with a given percentage of the moving average. This percentage can be changed from "Percentage".
|
