Relative Strength Index
Relative Strength Index
Relative Strength Index
|
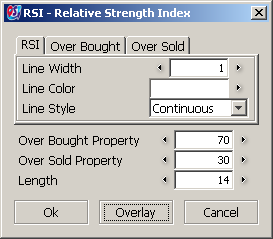
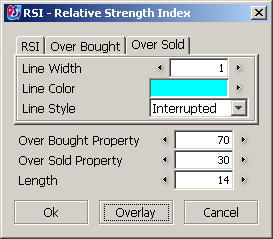
"Length" - is the number of time periods used when computing the moving average
"Over Sold Property" - the level of oversold band set initially at 30 "Over Bought Property" - the level of overbought band set initially at 70 |
|
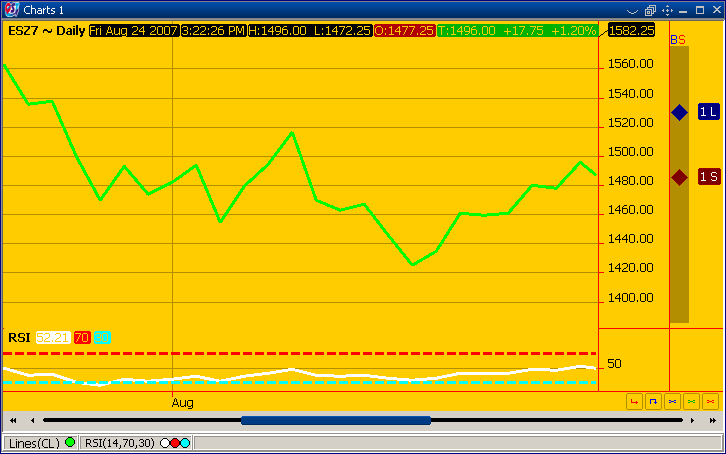
The "RSI" (Relative Strength Index) Indicator consists of three bands:
- an oversold band - an overbought band - the "RSI" band |
The formula for the "RSI" indicator is:
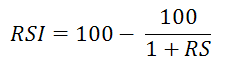
where:
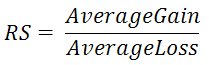
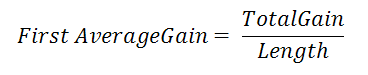
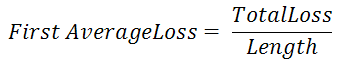
The first average gain and average loss are calculated the following way:
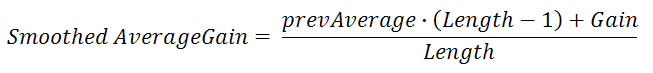
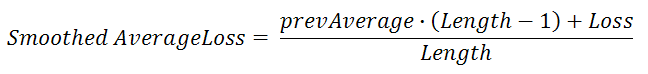
The second, and subsequent, calculations are based on prior averages and current gain/loss:
|
From "Indicator Properties" you can change the settings for indicator:
|
|
|
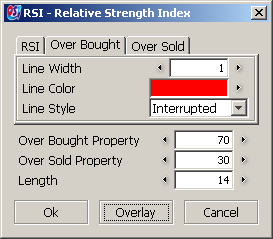
This dialog box has three sections: "RSI", "Over Bought" and "Over Sold". You can set line thickness, color and style in both of these sections. You can also change "Over Bought Property", "Over Sold Property" and "Length".
|