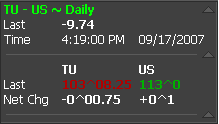
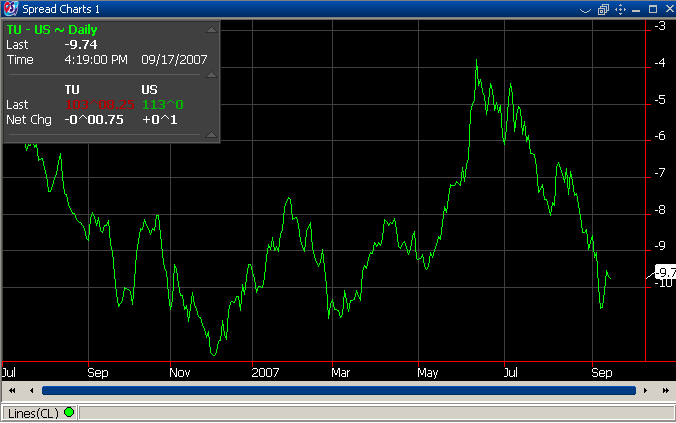
"Spread Charts" helps you to watch over the evolution of a contract in comparison with another one. A simple spread chart can be, for example, the price of the first contract minus the price of the second contract. In the example below there are two contracts: TU and US with the multipliers: 1 and -1.
|
The price for the "Spread Chart" is computed using formula: Spread Chart = a * X + b * Y where:
|
|
|
If you don't want to use contracts with multipliers you can write your own formula. See how a new spread chart is created.
See Spread Charts Toolbar components
See Spread Charts Key Bindings