 Triangular Relative Strength Index
Triangular Relative Strength Index
Triangular Relative Strength Index
|
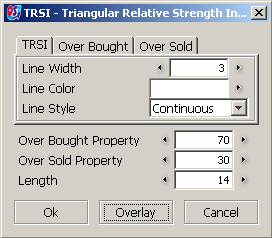
"Length" - is the number of time periods used when computing
the moving average
"Over Sold Property" - the level of oversold band set initially at 30 "Over Bought Property" - the level of overbought band set initially at 70 |
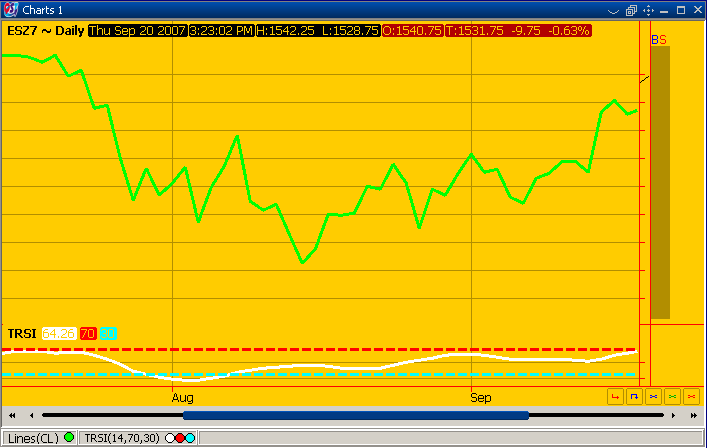
The "Triangular Relative Strength Index" (TRSI) is similar to RSI (Relative Strength Index) except that the average used here is TMA (Triangular Moving Average) instead of EMA (Exponential Moving Average).
|
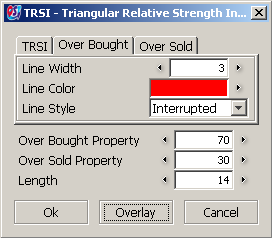
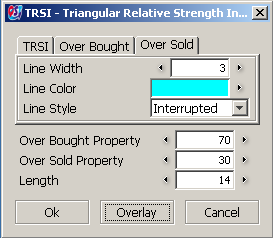
"TRSI" indicator consists of three bands:
- an "Oversold" band - an "Overbought" band - the "TRSI" band |
The formula for the "TRSI" indicator is:
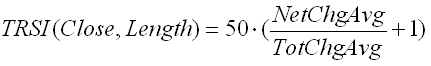
where:
| NetChgAvg = TMA(Change, Length) TotChgAvg = TMA( Abs(Change), Length) Change = Close - Close[-1] |
From "Indicator Properties" you can change the settings for indicator:
 |
 |
|
|
