|
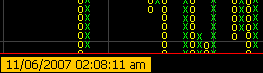
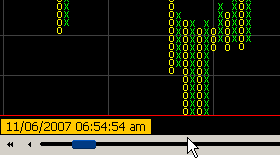
Scroll tooltip The scroll has a tooltip where is shown the time for the current point and figure chart point. If there is no chart point selected, the tooltip will show the time for the default information point (the default information point can be changed from preferences dialog). |
|
|
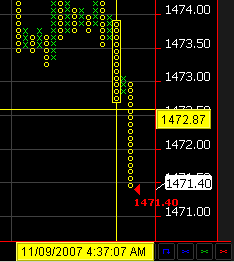
Timestamp and value If you press and hold the left mouse button while hovering over the chart, you will see two lines (horizontal and vertical) and on the scroll tooltip, the timestamp according to the vertical line will be displayed. On the values scale, the value according to the horizontal line will be displayed. |
|
|
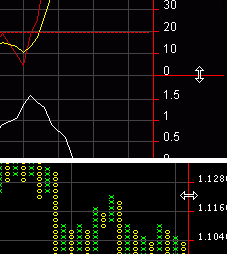
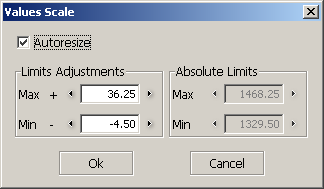
Change height of the study areas Starting with version 1.1.7 the little divider in between any study areas or between a study area and the chart area is sensitive to the mouse dragging feature. Simply hover on top of that line and you'll see the cursor change to a vertical arrowed line, then click and drag the line up or down to adjust the size of that area accordingly. Change width of the values scale The values scale width can be changed by dragging. The font used in chart will change it's size according to values scale width. For a small width of values scale - small fonts and for a bigger width of values scale - bigger fonts. Zoom in and zoom out the values scale While holding the mouse pointer over the values scale and moving the mouse wheel, you can zoom in or zoom out the values scale. This also applies for the values scale of the study areas. Values Scale dialog Starting with version 1.1.7 by double click on the values scale you open the "Values Scale" dialog. By disabling "Autoresize" you can change the minimum and maximum value for the scale. If "Autoresize" is selected, the scale will change it's size so the chart data will fit in graphic. |
|
You can move from one region of the chart to another using scrollbar. While scrolling it is very useful to have some information about the time (to know what you will see when you reach there), because of that we use a tooltip that shows the time as is shown in the figure below. The tooltip is shown when you move the mouse cursor over the scrollbar or when you scroll.
|
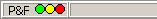
Double click on an item from the status bar will open the properties dialog for that item. For example double click on the "P&F" (see the figure below) will open the "Points And Figure Properties" dialog.
|
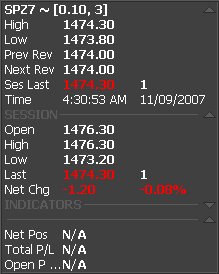
The "info box" is an alternative for labels.
The advantage of the "info box" is that it can be moved anywhere on the
chart by simply drag-and-drop to another location. The "info box" can also
be minimized. Each section of the info box has in the top of it a button
( )
from where you can hide the section (if there are any sections below this one
it will be hidden to). The button will change into
( )
from where you can hide the section (if there are any sections below this one
it will be hidden to). The button will change into
( ) from where you can make
the section visible again. To switch from info box to labels and reversal
use "switch to/from info box" button ) from where you can make
the section visible again. To switch from info box to labels and reversal
use "switch to/from info box" button
 from the toolbar.
The first section of info box refers to the information from the current P&F column
(X's or O's column). The second refers to the information for the current
trading session. The third is for the indicators values. from the toolbar.
The first section of info box refers to the information from the current P&F column
(X's or O's column). The second refers to the information for the current
trading session. The third is for the indicators values.
|
|