 Create a new Point & Figure Charts
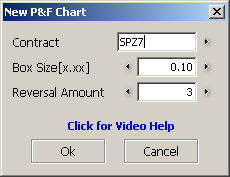
First you click on the "P&F Charts" button from shortcuts bar. Then a new frame called "P&F Charts 1" will appear in the current workspace. On the screen will appear the "New P&F Chart" dialog:
|
You can write a contract in the symbol field or choose a contract from
Contract Lookup Dialog
by clicking on the button near the symbol field  .
The box size and reversal amount have the defaut values - you can change them if you want.
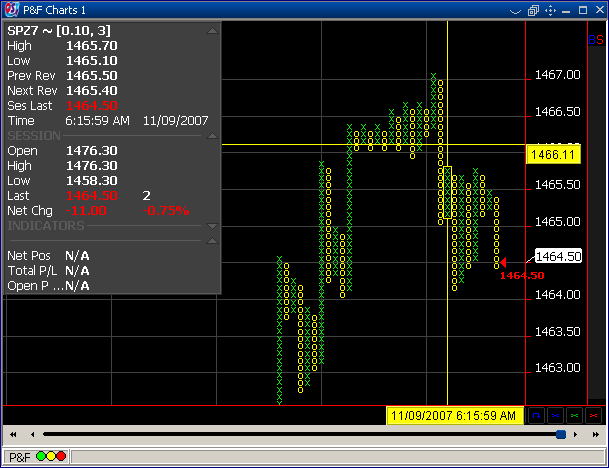
Then click "Ok" and the chart will appear:
.
The box size and reversal amount have the defaut values - you can change them if you want.
Then click "Ok" and the chart will appear:
|

 Working with indicators
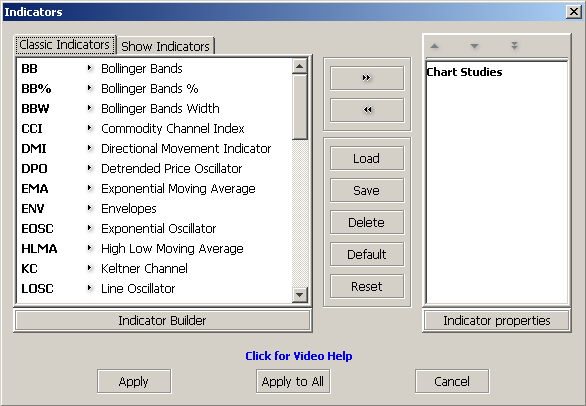
By clicking on the Indicators button, on the screen will appear the "Indicators" dialog:
|
There are two sections: "Classic Indicators" and "Show Indicators". The majority of the indicators are in the first section. In the other section are only the price formation indicators. These indicators don't take values for all the chart points, they will appear only if some conditions will be accomplished. For example the Highest High will appear only if the high for the current chart point is the highest from all the previous highs for a given period of time called "length".
To add an indicator click on an indicator from the left side list and then press
"Add Indicator" button  or simply highlight and double click the indicator you wish to add. First you will be prompted
for any adjustments you want to make for this indicator's values, then the indicator will appear
in the right side list. More than one indicator of the same type can be added on any particular
chart. If you want to remove an indicator, select the indicator (0click it) from the list
on the right and then press "Remove Indicator" button
or simply highlight and double click the indicator you wish to add. First you will be prompted
for any adjustments you want to make for this indicator's values, then the indicator will appear
in the right side list. More than one indicator of the same type can be added on any particular
chart. If you want to remove an indicator, select the indicator (0click it) from the list
on the right and then press "Remove Indicator" button
 .
The indicator will be removed.
.
The indicator will be removed.
Starting with version 1.1.7 the indicators can be grouped in what we call different study areas. Newly added indicators are going to be merged in the "Chart Studies" group if their behavior allows for that or simply in a completely new study area. From the selected indicator list (the one on the right) simply highlight the indicator you wish to move and then use the arrow buttons atop that list to make your selection move accordingly through the list. Study areas can be moved as well, by highlighting the container for the indicators included. This list is now acting as a preview of how the indicators are going to be displayed on the actual charting area and the settings are going to be saved across sessions and within the user defined templates.
To change the properties of an indicator, select the indicator (from right side list) and press "Indicator Properties" button or simply double click the indicator. Each indicator has its own property list. Click here to see more about Indicators.
You can save these settings in a template. Press "Save" button and "Save Template" dialog will appear. You can save the template with a new name or you can overwrite an existing template. From "Load" button you can load an existing template. Delete button will open the "Delete Template" dialog from where you can delete an existing template. "Default" button is used to set the current template as default. The "Reset" button will reset the current template by loading default template.
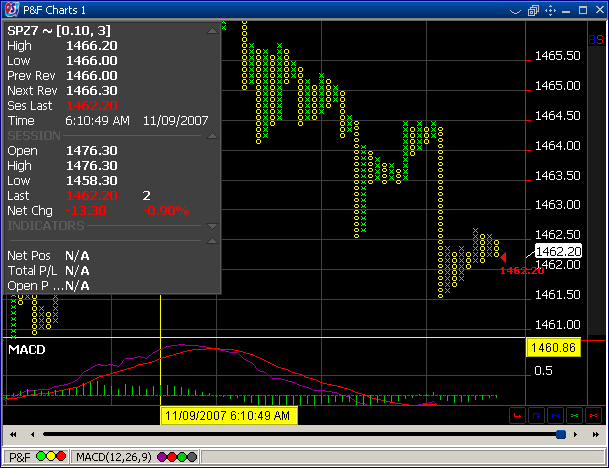
For this example we'll use the default properties for this indicators. If everything is Ok, press the "Ok" button and the indicators will appear on the chart:
|
Starting with version 1.1.7 the little divider in between any study areas or between a study area and the chart area is sensitive to the mouse dragging feature. Simply hover on top of that line and you'll see the cursor change to a vertical arrowed line, then click and drag the line up or down to adjust the size of that area accordingly.