 Create a new chart
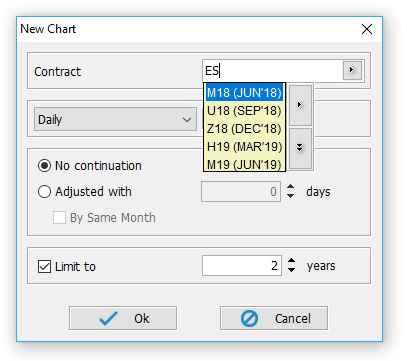
First you click on the "Charts" button from shortcuts bar. Then a new frame called "Charts 1" will appear in the current workspace. On the screen will appear the "New chart" dialog:
|
You can write a contract in the symbol field or choose a contract from
Contract Lookup Dialog by clicking on the
button near the symbol field  . The resolution can be also
changed. For example you can choose an intraday 1 minute resolution if you watch over a chart that extends over a
few days, or a monthly resolution if you watch over a chart that extends over one year.
. The resolution can be also
changed. For example you can choose an intraday 1 minute resolution if you watch over a chart that extends over a
few days, or a monthly resolution if you watch over a chart that extends over one year.
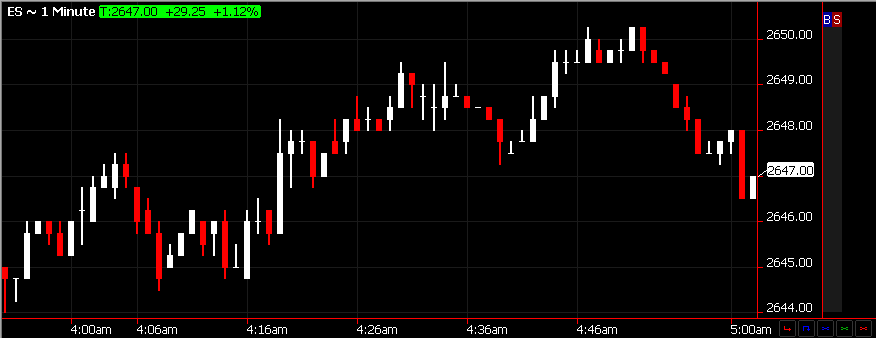
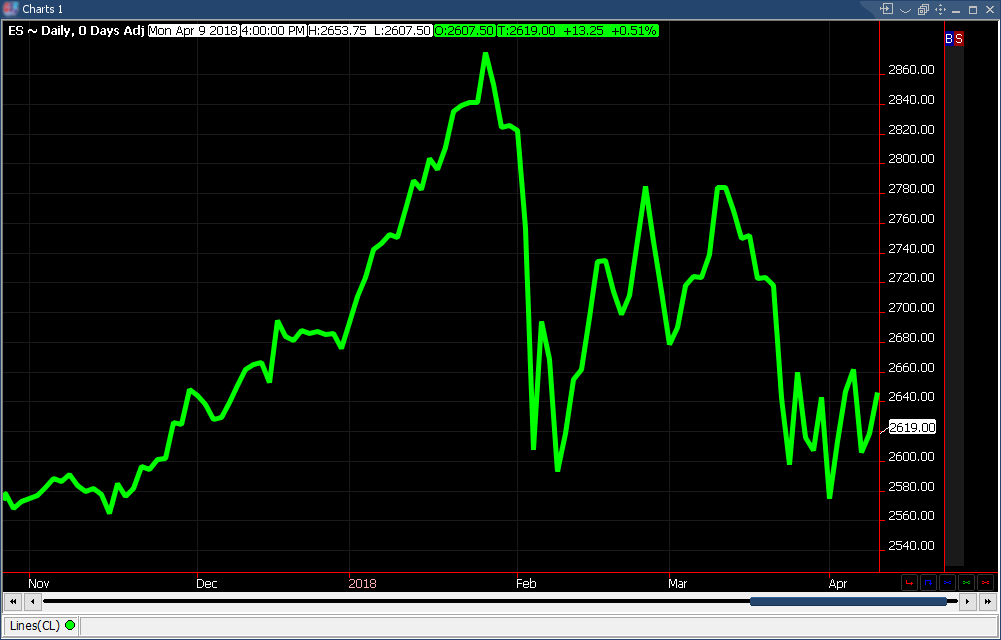
In the chart will be loaded all the data that server can offer for the specified resolution. The amount of data can be limited by choosing "Limit to" option where you can write a limit. In this example the limit is set at 3 days. Then click "Ok" and the chart will appear:
|

When you want to create a new chart where you don't specify the trading month, you can use the continuation options from the "New Chart" dialog box (see the picture above). If you choose the "No continuation" option the chart will represent just the front month.
The "Adjusted with # days" option will allow you to specify when to transition to the next trading month. For example, if you choose "Adjust with 2 days" and we know that ESU7 expired September 30th, so at that moment ESZ7 became the front month. We use the data for ESU7 until September 28th and then transition to ESZ7.
"By month" means that the chart will be composed only from the selected calendar month.
"Equalize closes" applies a "smoothing" algorithms between data from two different contracts so the transition is not so severe.
|
|
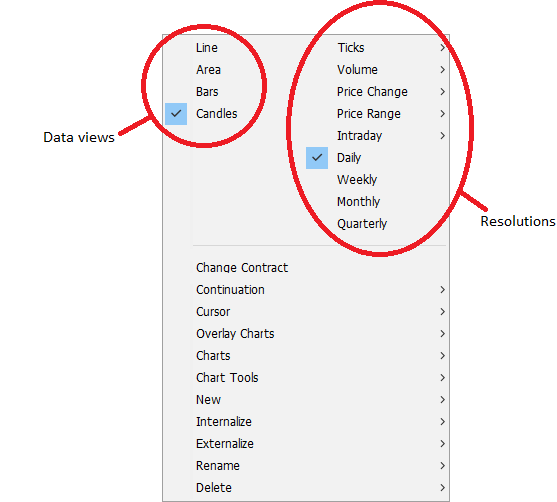
The chart area contains a region of the chart or the entire chart if the chart fits in the chart area. The chart data can be shown with a different data view. The data views used in this module are: Line, Area, Bars and Candles. You can change the current data view directly from the chart using the right click on the chart area. This will open a box from where you can choose a data view as it's shown in the picture on the right. The resolution can also be changed by choosing a resolution from the "Resolutions" section. You have seven options for this: Ticks, Volume, Intraday, Daily, Weekly, Monthly and Quarterly. |
|
|
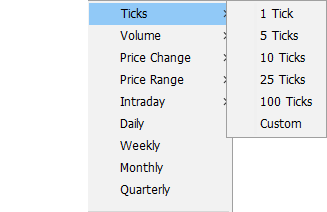
"Ticks" - displays the trades for a certain contract. It has 5 default resolutions: 1 Tick, 5 Ticks, 10 Ticks, 20 Ticks and 100 Ticks. Custom tick resolutions can be set from the "New Chart" dialog. |
|
|
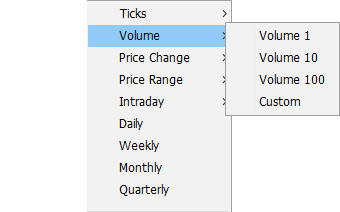
"Volume" - displays the trades by volume (number of contracts traded) for a certain contract. It has 3 default resolutions: Volume 1, Volume 10 and Volume 100. Custom volume resolutions can be set from the "New Chart" dialog. |
|
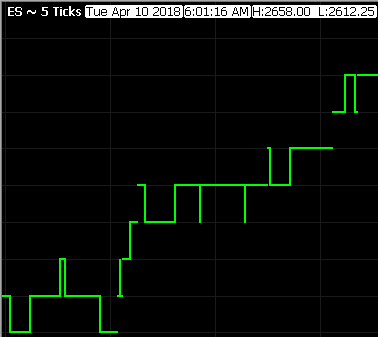
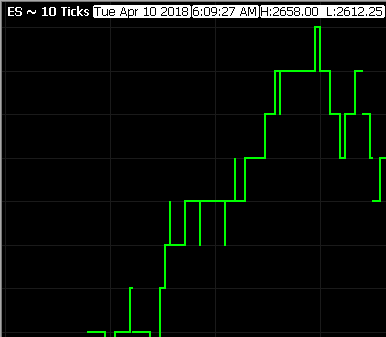
The first figure below represents a part of the RZ7 chart using 5 Ticks resolution. The second figure represents a part of the RZ7 chart with 10 Ticks resolution.
|
|
 Working with indicators
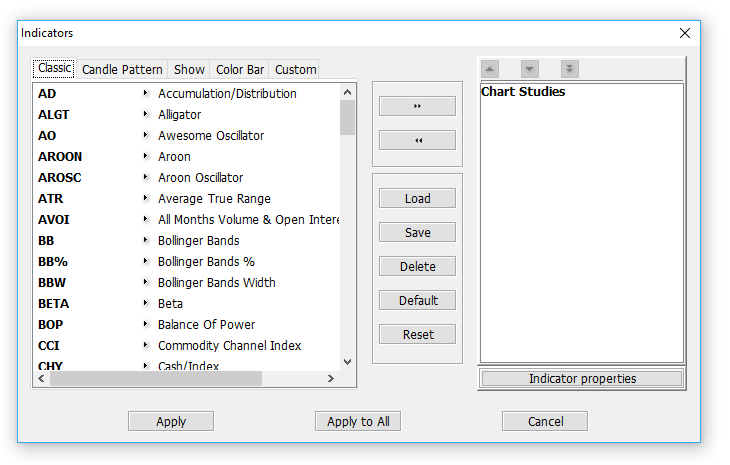
 By clicking on the indicators button, on the screen will appear the "Indicators" dialog:
|
There are two sections: "Classic" and "Show". The majority of the indicators are in the first section. In the other section are only the price formation indicators. These indicators don't take values for all the chart points, they will appear only if some conditions will be accomplished. For example the highest high will appear only if the high for the current chart point is the highest from all the previous highs for a given period of time called "length".
To add an indicator click on an indicator from the left side list and then press "Add Indicator" button
 or simply highlight and double click the indicator you wish to add.
First you will be prompted for any adjustments you want to make for this indicator's values, then
the indicator will appear in the right side list. More than one indicator of the same type can be
added on any particular chart. If you want to remove an indicator, select the indicator
(click it) from the list on the right and then press "Remove Indicator" button
or simply highlight and double click the indicator you wish to add.
First you will be prompted for any adjustments you want to make for this indicator's values, then
the indicator will appear in the right side list. More than one indicator of the same type can be
added on any particular chart. If you want to remove an indicator, select the indicator
(click it) from the list on the right and then press "Remove Indicator" button
 . The indicator will be removed.
Starting with version v 1.1.7. the indicators can be grouped in what we call different study areas. Newly added indicators are going to be merged in the "Chart Studies" group if their behavior allows for that or simply in a completely new study area. From the selected indicator list (the one on the right) simply highlight the indicator you wish to move and then use the arrow buttons atop that list to make your selection move accordingly through the list. Study areas can be moved as well, by highlighting the container for the indicators included. This list is now acting as a preview of how the indicators are going to be displayed on the actual charting area and the settings are going to be saved across sessions and within the user defined templates.
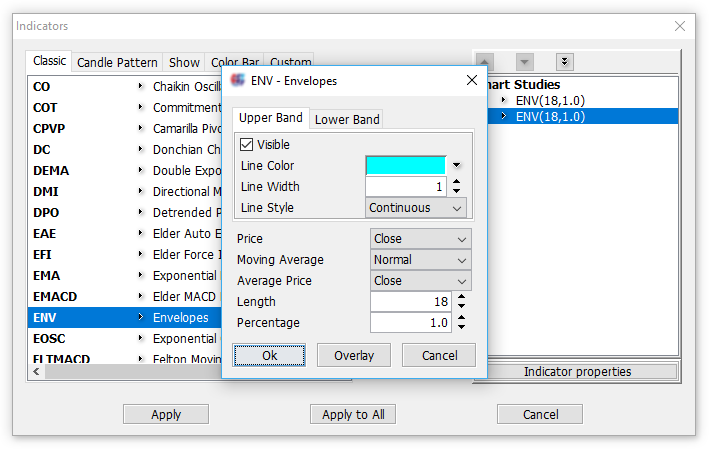
To change the properties of an indicator, select the indicator (from right side list) and press "Indicator Properties" button or simply double click the indicator. Each indicator has its own property list.
|
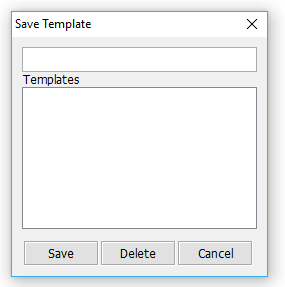
You can save these settings in a template. Press "Save" button and "Save Template" dialog will appear. You can save the template with a new name or you can overwrite an existing template. From "Load" button you can load an existing template. Delete button will open the "Delete Template" dialog from where you can delete an existing template. "Default" button is used to set the current template as default. The "Reset" button will reset the current template by loading default template.
|
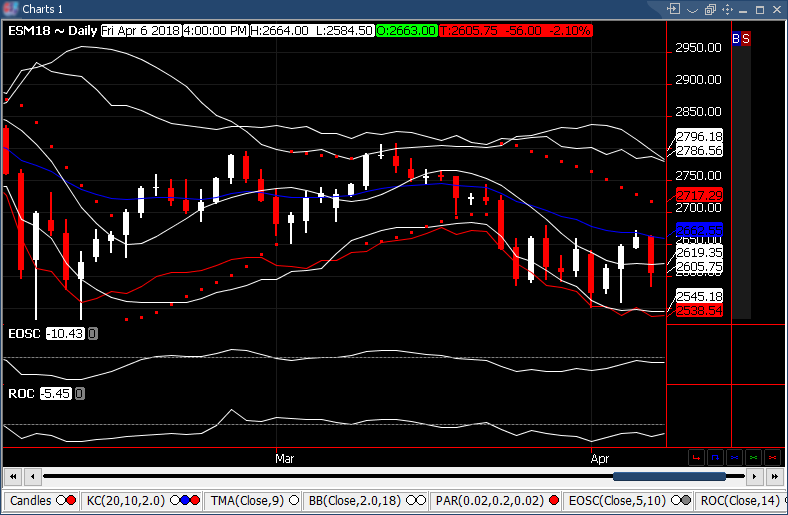
For this example we'll use the default properties for this indicators. If everything is OK, press the "Ok" button and the indicators will appear on the chart:
|
Starting with version v 1.1.7. the little divider in between any study areas or between a study area and the chart area is sensitive to the mouse dragging feature. Simply hover on top of that line and you'll see the cursor change to a vertical arrowed line, then click and drag the line up or down to adjust the size of that area accordingly.
 Switch mode
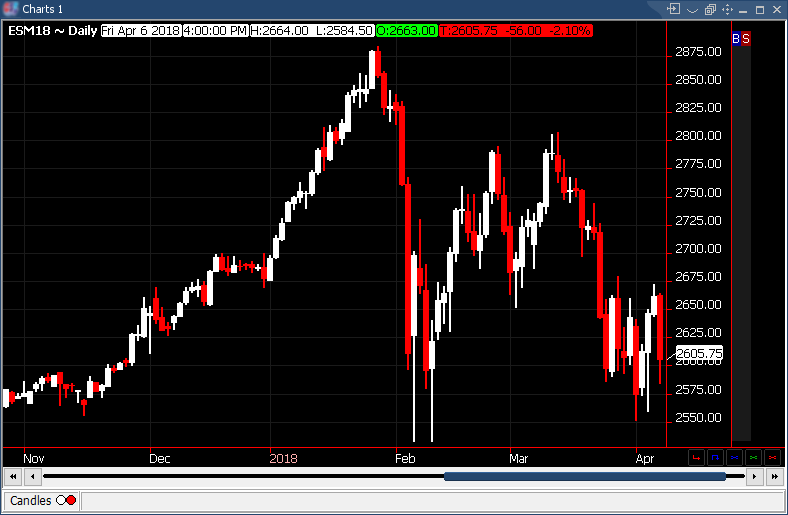
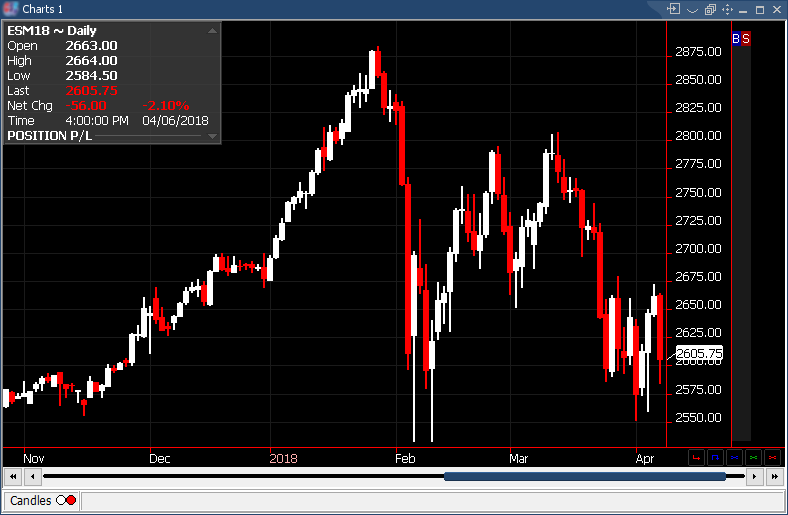
 You can visualize the data for a chart point as different labels placed on chart or you can visualize the data according to a chart point in a "info box". The "info box" can be moved anywhere on the chart by drag-and-drop to another location.
|
|
|
|
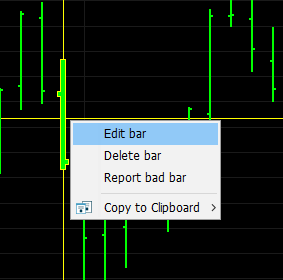
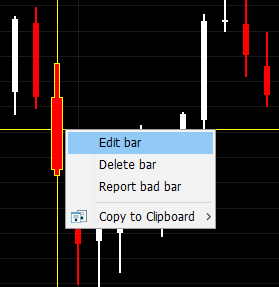
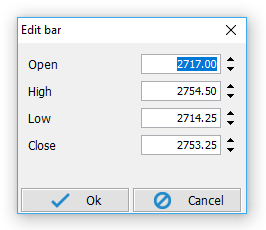
| By clicking on "Edit Bar" option, the "Edit Bar" dialog (see the figure on the right) appears. In this dialog box the user can set the "Open", "High", "Low" and "Close" prices for the bar which was selected. The "Delete Bar" option can delete a bar from the chart. These options affect the chart until a new reload is done. |
|
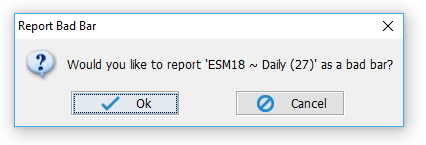
| If the user thinks that a bar or candle represents bad data, he can use the "Report bad bar" option, which sends a warning to the techical support automatically. Before sending the warning, the "Report Bad Bar" dialog box (see the figure in the right) appears, which requests the user to confirm it. |
|