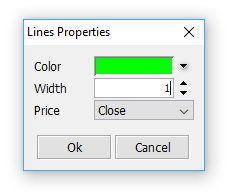
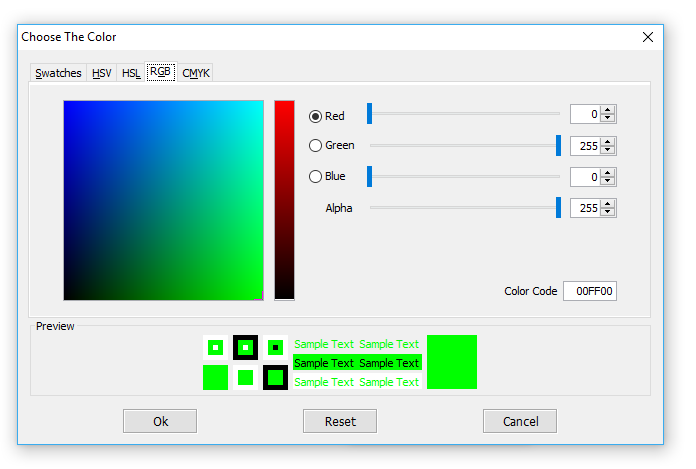
Color
By pressing the  button, the
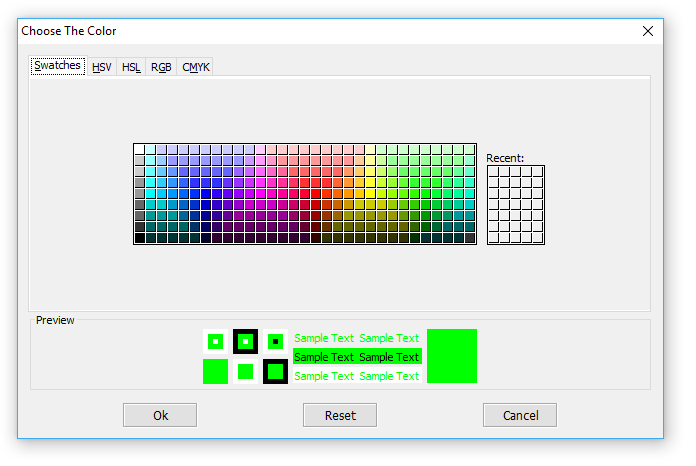
"Choose The Color" dialog appears. Here you
can set the color of the
line chart.
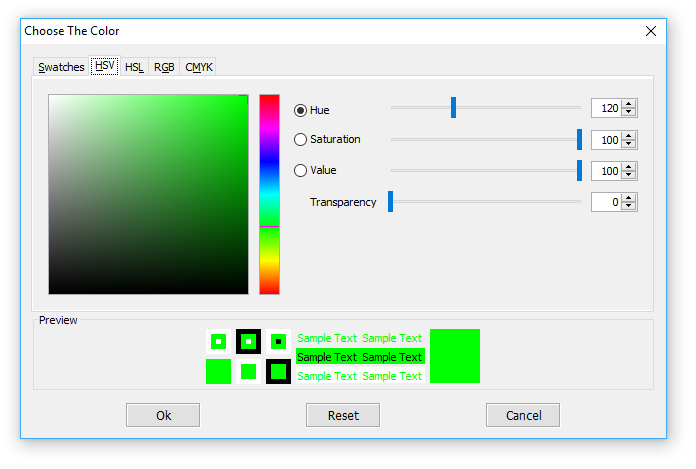
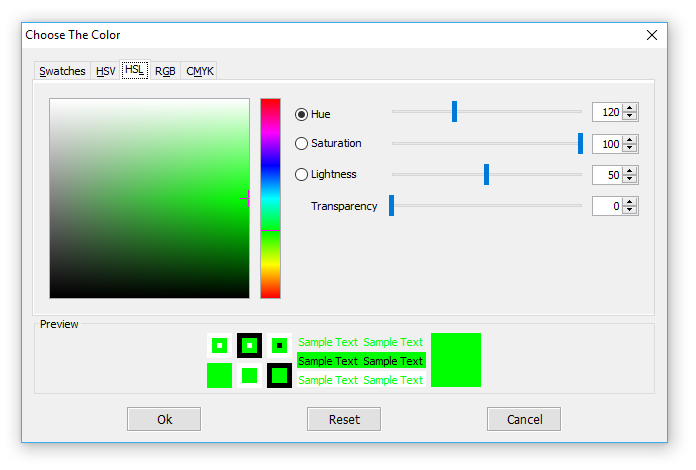
You have five possibilities for set this color: Swatches, HSV, HSL, RGB or CMYK (see the
figures below).
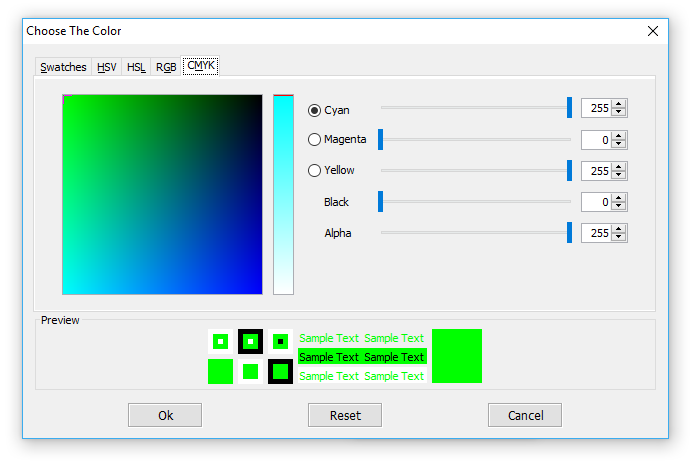
button, the
"Choose The Color" dialog appears. Here you
can set the color of the
line chart.
You have five possibilities for set this color: Swatches, HSV, HSL, RGB or CMYK (see the
figures below).
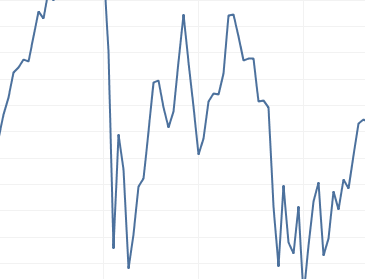
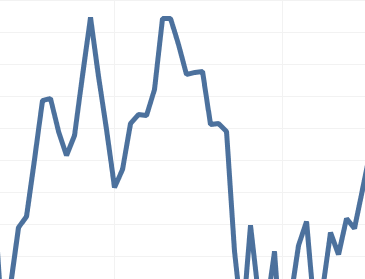
Width
This option sets the width of the line in the chart (the minimum value is 1 and the maximum is 5). You can see two examples below
for this option. In the first figure the width of the line is 2, in the second figure is 5.
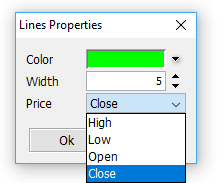
Price
The prices used for the line chart
are: close, low, high and open. By default the price used is close. In the
figure below you can see how can you change this option.
Controls
"Ok" button - this will change the previous setting with the actual settings
"Cancel" button - the change in setting will be ignored |