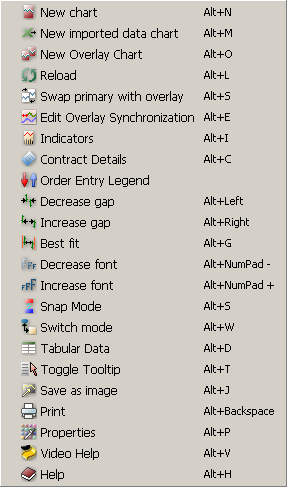
The first sub-menu in "Point and Figure Charts" is "Charts" and its components are represented in the figure below.
|
|
 New chart
|
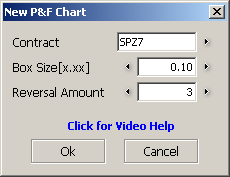
You can write the contract name or choose it by simple click on the button from the right of symbol field
If you want to change the contract in a "Point and Figure Charts" frame you can simply type the name of the contract and the "New P&F Chart" dialog will appear. Another way is to open the "New P&F Chart" dialog and type there the contract or choose it from Contract Lookup Dialog. If everything is OK then press "Ok" button. After the "Contract" symbol, you can select the "Box Size[x.xx]" and the "Reversal Amount". |
|
 New imported data chart
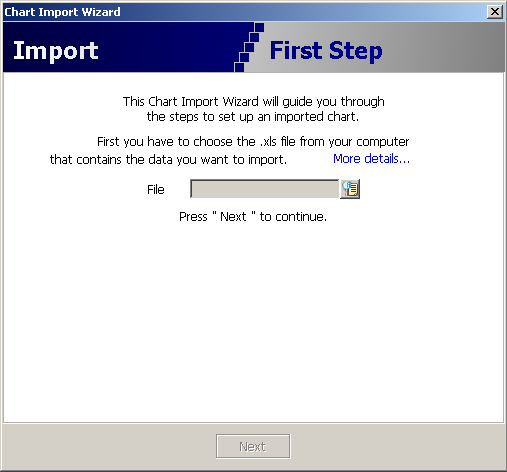
If this button is pressed the "Chart Import Wizard" appears (see the
figure below). In this dialog you can browse for an Excel file (by pressing
the  button) and
import data from it for a new chart.
button) and
import data from it for a new chart.
|
 Reload
This will require the server for redraw the "Point and Figure Chart".
 Indicators
An indicator is a mathematical formula that can be applied to chart data. The result is a value that is used to anticipate future changes in prices.
See How to work with indicators
 Contract Details
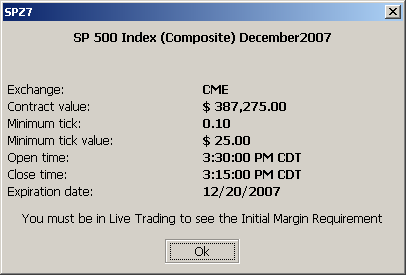
This will open a dialog that contains details for the current contract(s) (see the figure below).
 |
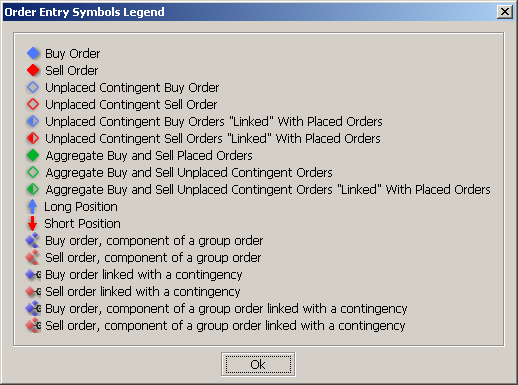
 Order Entry Legend
This will open a dialog with the legend for the symbols used in order entry.
|
 Decrease gap
This will decrease the distance between two chart points. If you had changed the bars or candles from large to small, the distance between two points remains the same. So you can press "Decrease gap" button to decrease that distance (the gap).
 Increase gap
This will increase the distance between two chart points.
 Best fit
This option makes the best fit between two chart points.
 Decrease font
This will decrease the size of fonts that are used in "Point and Figure Charts". The dimension of rows will be also modified according to the new font size.
 Increase font
This will increase the size of fonts that are used in "Point and Figure Charts". The dimension of rows will be also modified according to the new font size.
 Snap Mode
Snapping mode is active when a line is drawn.
See a detailed presentation of using Snap Mode
 Switch mode
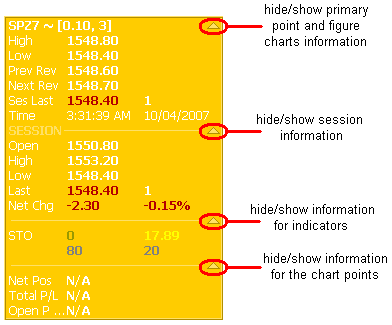
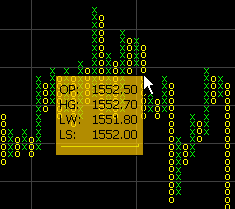
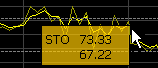
The data for a chart point can be visualized as different labels placed on the chart or in an "info box" as it's shown below in the pictures. The advantage of using "info box" is that it can be moved anywhere on the chart by drag-and-drop. The "info box" has three sections:
|
- one or more for hide/show primary and overlayed charts information. In the example below we have a primary and one
overlayed chart.
- one for hide/show information for indicators. - one used to hide/show information for the chart point. |
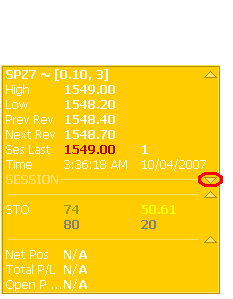
This sections are represented in the first figure below. The second pictures represents an info box which has one of this buttons pressed.
 |
|
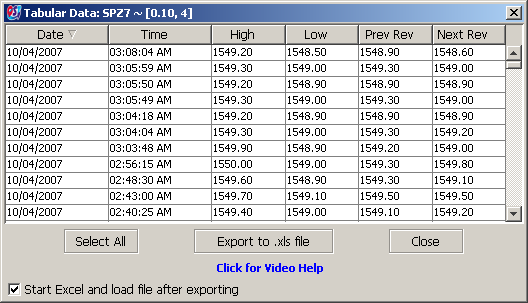
 Tabular Data
If this button is pressed the "Tabular Data" dialog will appears (see the figure below). From this dialog you can select the data you need (you can use the "Select All" button for selecting all the data from the table) and export to an Excel file by pressing the "Export to .xls file" button.
|
 Toggle Tooltip
This feature enables a tooltip to appear when the mouse is over the chart or over an indicator. The tooltip will show you all information about the session where the mouse is positioned.
|
|
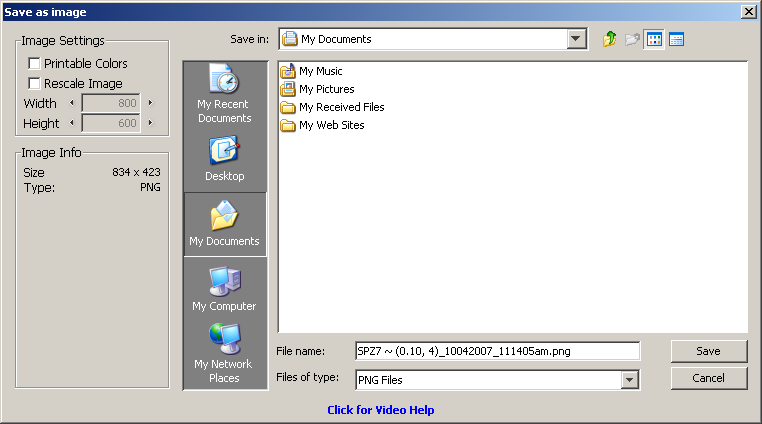
 Save as image
The chart can be saved as JPEG or PNG image. If you don't write the extension of file: ".jpg", ".jpeg" or ".png"; this will be set as default: ".jpg" or ".png" according to the file type.
|
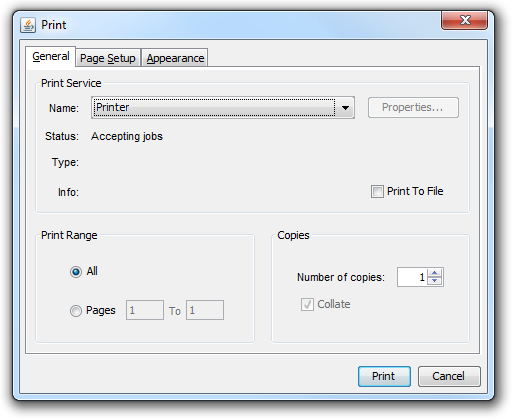
 Print
Print
This will open a dialog with three tabs.
From "General" you can set the print service, the print range and the number of copies you want to make.
|
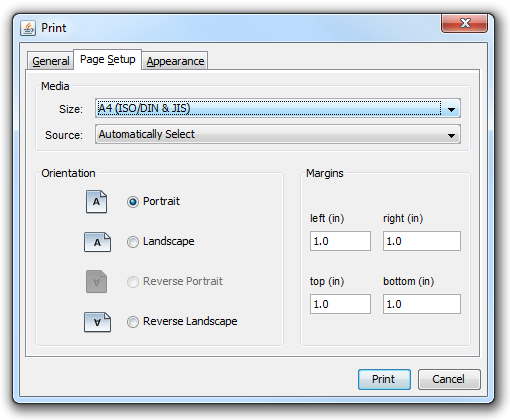
From "Page Setup" you can set the media, the orientation and the margins of the page.
|
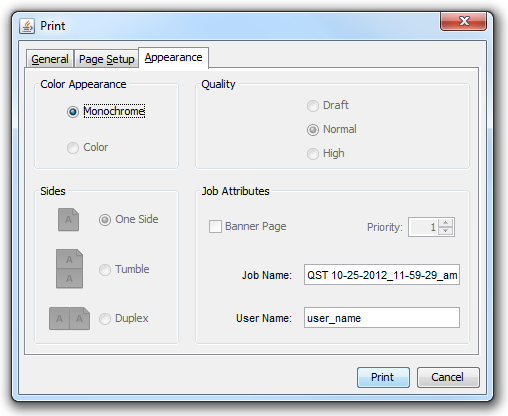
From "Appearance" you can choose the color and the quality of the printing.
|
 Video Help
This will open a web browser and gives you video instructions about "Point and Figure Charts" module.
 Help
Help
It opens the Help for "Point and Figure Charts" module.
 Properties
See the Point and Figure Charts Properties

 . This will open the