 Advanced Options Columns Advanced Options Columns
As we presented in the main Advanced Options page, the Advanced Options frame contains a Futures Table and tabs with Options Tables. By default, each tab is made up of 3 sub-tables: Calls, Puts and Strikes Table.
Every table has different structure and columns. To learn how you can add or remove columns from your Advanced Options tables, read the Advanced Options Properties page.
In order to change the columns of the Futures Table, go to the Underlying Columns tab of the Advanced Options Properties dialog.
The following columns are already present or can be added to / removed from your Advanced Options Futures Table:
| Last | Open | Close | Order Entry |
| Bid | Ask | High | Low |
| Net Change | Net Change % | Volume | Open Interest |
| Previous Settlement | Monetary Value | Time |

In order to change the columns of the Calls and Puts Tables, go to the Options Columns tab of the Advanced Options Properties dialog.
The following columns are already present or can be added to / removed from your Advanced Options Calls/Puts Tables:
| Last | Bid | Ask | Order Entry |
| High | Low | Net Change | Net Change % |
| Volume | Open Interest | Previous Settlement | Time |
| Monetary Value | Fair Value | Usr. Fair Value | Delta |
| Gamma | Rho | Theta | Vega |
| Exp. Date | Days to Exp. | Usr. Days to Exp. | Usr. Variance |
| Usr. Volatility | Implied Volatility | Volatility Chart |
In order to change the columns of the Strike Table, go to the Fixed Columns tab of the Advanced Options Properties dialog.
The following columns are already present or can be added to / removed from your Advanced Options Strike Table:
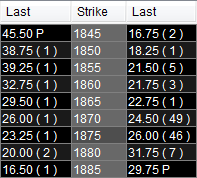
| Strike | Last | Bid | Ask |
| High | Low | Net Change | Net Change % |
| Volume | Open Interest | Previous Settlement | Time |
| Monetary Value | Fair Value | Usr. Fair Value | Delta |
| Gamma | Rho | Theta | Vega |
| Exp. Date | Days to Exp. | Usr. Days to Exp. | Order Entry |
| Implied Volatility | Volatility Chart | Usr. Variance | Usr. Volatility |
|
Last - The price of the last trade (or settlement marked with an S if the market has closed and the settlement price has already been sent). It can also display a pre-/post- trade indicator (P) for pre-/post- session prices (applicable for equity quotes), not to be confused with the P displayed as a previous settlement indicator (in the case of futures). The D mark informs that data is being disseminated with delay. The Last cells will be highlighted whenever a new trade is made, which forces the value change. In order to change the color of the highlight please go to the Advanced Options Properties dialog, Look tab, Last, Low and High highlight colors. You can also select the Last Foreground like Net Change option (from the same Advanced Options Properties dialog, Look tab) to set the text color in the Last column to have the same settings as the Net Change column. |
|
In order to read more about this column, please take a look at the Order Entry in Advanced Options section of this help by clicking here.
The Monetary Value column represents the value in $ of the price. Each price represents a number of unities. Each unity has a value in $. The monetary value is obtained by multiplying these two values.
Net Change - The variation of the current price (last/trade) related to the previous settlement. It can be either positive or negative, based on the market trend. If a cell is marked N/A, it means that the information is not available.
Net Change % - The variation of the current price (last/trade), explained in percents, related to the previous settlement. It can be either positive or negative, based on the market trend.
In order to change the text color of the negative and positive Net Change values, please go to the Advanced Options Properties dailog, Look tab, Prices Odd/Even Rows Colors sections.
High is the highest value reached in the current trading session.
Low is the lowest value reached in the current trading session.
You can highlight these cells when the information is updated. In order to change these settings, please go to the Advanced Options Properties dialog, Look tab, Last, Low and High highlight colors.
Bid - The price that a market participant is prepared to pay at a particular time to buy a commodity.
Ask - The price that a market participant is prepared to pay at a particular time to sell a commodity.
Volume is the number of shares, certificates or contracts that changed hands during one trading day.
Open Interest the total number of options and/or futures contracts that are not closed or delivered on a particular day.
Prev. Settlement - The price at which the market has closed its previous session.
Time shows the time at which the last trade occurred.
Open - The first price at which a security trades upon the opening of a trading day.
Close - The final price at which a security is traded during a trading day.
Strike - Represents a list of all possible prices to which an option can be attached to.
In order to change the settings used for this column, please go to the Advanced Options Properties dialog, Look tab, Strikes section.
You can also change the alignment of the text for this column, from the same tab, Alignment section.
Delta - Measures the change in option value for a small change in futures price. Delta is the ratio of the change in an option's price to a given change in the price of the underlying asset or instrument. If the underlying changed by a given amount the option price would change by a fraction (delta) of that amount.
Gamma - Measures the rate of change of delta for a small change in futures price. Gamma is the rate of change of an option's delta with respect to a change in the price of the underlying assets or instrument. If the underlying changed by a given amount the option delta would change by a fraction (the gamma) of that amount. It measures how fast the delta changes for small changes in the underlying futures price. Gamma is also known as the first derivative of Delta, measures the rate of change of Delta.
Rho - Measures an option's change in value given a change in interest rates.
Theta - Measures the rate at which an option's value decreases over time. Theta is the change in option value with respect to time and it is almost always large and negative, when Gamma is large and positive, vice versa. Theta is not used much by traders, but it is an important conceptual dimension. It measures the rate of decline of time-premium resulting from the passage of time.
Vega - Measures an option's change in value for a small change in volatility. Vega also known as zeta, kappa or lambda is the change in option value with respect to implied volatility. While the name of the other option sensitivities have corresponding Greek letters, Vega is the name of a star. It quantifies risk exposure to implied volatility changes and also tells us approximately how much an option price will increase or decrease given an increase or decrease in the level of implied volatility.
Exp. Date - shows the contract's expiration date.
Days to Exp. - This column indicates how many days are left until the expiration day.
Usr. Days to Exp. - This column allows you manually enter the days until expiration for current strike, which will affect the calculation of Greeks, Usr. Volatility and Usr. Fair Value.
Implied Volatility is the estimated volatility of a security's price. In general, implied volatility increases when the market is bearish and decreases when the market is bullish. This is due to the common belief that bearish markets are more risky than bullish markets.
The Volatility Chart illustrates the evolution of the volatility.
Fair Value - The estimated price value for the selected option, which usually should be close to or identical to the current option price on the market.
Usr. Fair Value - The same estimate, this time based on the Usr. Volatility value instead of the Implied one.
The Usr. Volatility - In this column you can manually enter a Volatility value for the option, which will be used for calculating other columns, such as Usr. Fair Value, Usr. Variance, and even Greeks (if enabled from the Advanced Options Properties dialog).
The Usr. Variance calculates the difference between the Usr. Fair Value and the one of the Implied Volatility.