Order Entry in Charts

You can buy or sell from this module. To do that you must configure the Order Entry from Order Entry Properties. First, assure that you are connected to an order entry provider. Then go to "Customize Order Type When Clicking on Last or Bid/Ask" section and set up the order types for each exchange, session, price location and side. Go to the next section "Customize Other Order Entry Actions and Properties", for "When Placing an Order" property you can select one of the following:

- "Enter the order immediately" - the order will be placed without showing a confirmation dialog.

- "Preview the order" (recommended) - will open a preview dialog from where you can change one or other and then submit or cancel. From here you can switch to Order Ticket if you want to change some fields that are not editable in preview.

- "Show the Order Ticket" - will open the Order Ticket from where you can change all the fields for the new order.

Next, you must select one of the following:

- "Place order by single-clicking" - single click on charts slider will enter the order immediately, preview the order or show the Order Ticket depends on the "When Placing an Order" property.

- "Place order by double-clicking" - double click on charts slider will enter the order immediately, preview the order or show the Order Ticket depends on the "When Placing an Order" property.

* If nothing is selected (single-click or double click), one-click trading cannot be used.

Orders

To place an order on chart you need the chart orders slider. The slider will be visible only if the order entry is enabled for charts. Left click on the slider will place a buy order, while right click on it will place a sell order. You can also use the right click popup to place a buy or a sell order. If the slider has the selection focus you can use Ctrl + Left Arrow for a buy order and Ctrl + Right Arrow for a sell order.

Beside price and order side, all the other order fields will be set according with the Order Entry Properties.

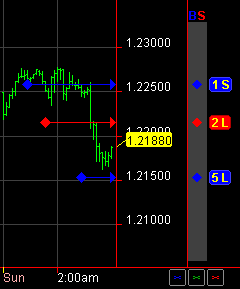
In the example from the screenshot, the buy orders are blue and the sell orders are red. They are visible both: on the slider and directly on the chart.

At the bottom, you have three buttons:

- "Cancel Buy Orders" - will cancel all buy orders for the current contract
- "Cancel All Orders" - will cancel all orders for the current contract
- "Cancel Sell Orders" - will cancel all sell orders for the current contract

You can cancel an order too, by dragging and dropping the order off the Order Entry column. When you drag-and-drop an order, a dialog box appears. In this dialog box, the user have to confirm, if he wants to cancel the drag-and-dropped order.


When the orders are filled, the representation are changed in directional arrows, each arrow will be placed at the filling time and at the filling price.

The numbers near the arrows represent the net quantity which is the quantity that remains after matching the fills and positions. A negative quantity means a short net position while a positive quantity means a long net position. A zero quantity represents a flat net position.

A long net position is also represented as an up-oriented blue arrow, while a short net position is represented as a down-oriented red arrow. The flat net positions are represented as white arrows.

If two or more positions should be represented at the same coordinates then they will be drown as a double arrow.

Between the arrows there are profit/loss lines that symbolize the loss or gaining when matching two fills. The blue lines represent a profit while the red lines represent a loss. The white lines represent a breakeven.

You can place in the Order Entry section of this frame, "Contingent orders", too. To read more about them, click here.

Go to the top of page