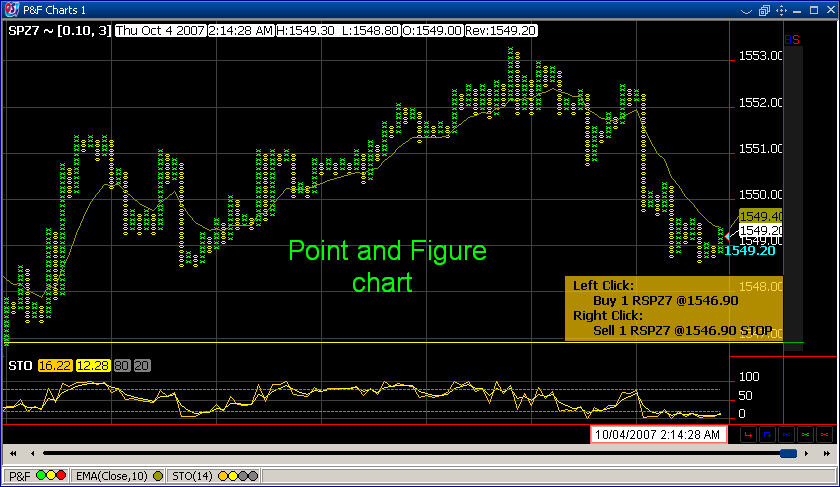
A chart display historical data for an issue in graphical format. There are many ways in the representation of data. One of them is called "Point and Figure Chart".
The point and figure chart graph an issue's significant up and downtrends over a specified period of time. The box size tells how greater must be the change in price to be significant and the reversal shows the number of boxes that are required to change the trend. Each X indicates that price has increased with the value of one box (with one box size); each O indicates that price has decreased with the value of one box.
|
A column of X's represent an up trend and a column of O's represent a down trend.
The
Point and Figure Charts are used to
identify support levels, resistance levels and chart patterns. The charts ignore the time factor and concentrate only on
movements in price - up trends and down trends represented by columns of X's and O's.
See Point and Figure Charts components
See Point and Figure Charts Toolbar components
See Point and Figure Charts example
See Point and Figure Charts Key Bindings
