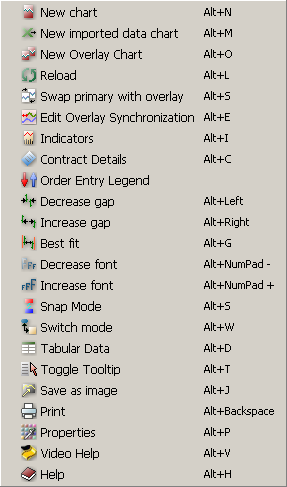
The third sub-menu in "Spread Charts Toolbar" is "Charts" and its components are represented in the figure below.
|
|
 New chart
|
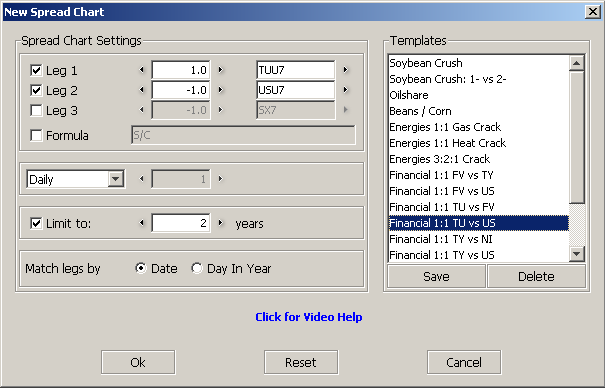
There are two sections: "Spread Chart Settings" and "Templates".
The spread chart in the figure is composed from two contracts: TU and US with the factors: +1 and -1. The spread chart is calculated using formula: 1*TU - 1*US.
|
You can create a new spread chart in two ways:
- using Legs: choose the contracts and the factors (as is shown in the figure) or - using a formula: write it in the formula field. |
The formula may contain operators: "+", "-", "*", "/", parenthesis: "(", ")", variables as: "RBOV7", "CLV7" or "TYU7" which are contracts and any float number as factors. The values as "2.4651E+1" are NOT accepted. Some examples of formulas:
|
ES - 2.5*SP
ESU05 - (2*SPU05 + ECU05 - ECM05) ES1- - 2*SP1- |
The advantage of using formula is that you can use unlimited number of contracts in your formula. If you don't use formula you are limited at three contracts.
You can save the formula or the Legs combinations that you are using for a spread chart (using "Save" button) in a template and use this template any time you need it. If you no more need a template you can delete it. To delete a template, first you have to select it and then press "Delete" button.
 New imported data chart
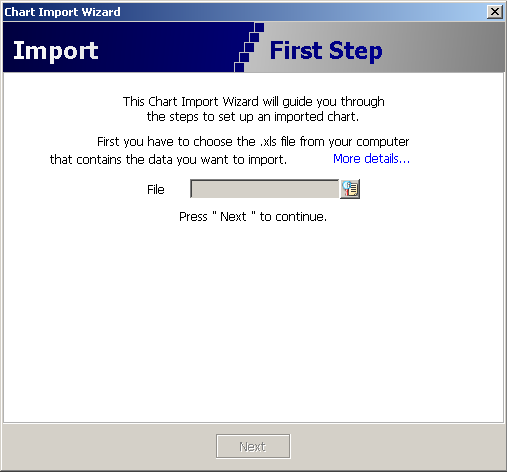
If this button is pressed the "Chart Import Wizard" appears (see the
figure below). In this dialog you can browse for an Excel file (by pressing
the  button) and
import data from it for a new chart.
button) and
import data from it for a new chart.
|
 New Overlay Chart
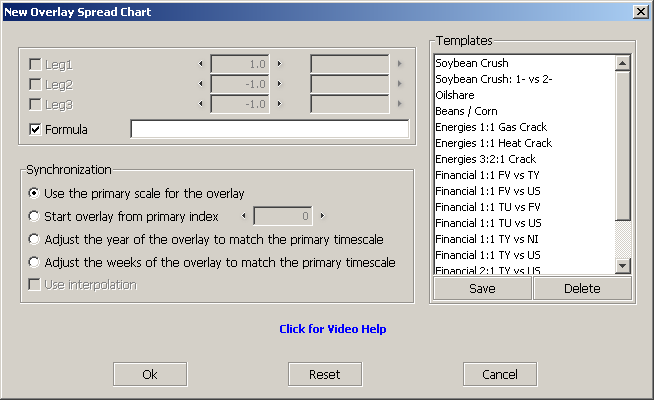
By pressing this button you can select a new contract from the "New Overlay Chart" dialog.
If you press the  button beside the
"Contract" label, you can select the
contract from the Contract Lookup Dialog.
In this dialog you can set the Continuation and the Synchronization for the chart which will be drawn.
button beside the
"Contract" label, you can select the
contract from the Contract Lookup Dialog.
In this dialog you can set the Continuation and the Synchronization for the chart which will be drawn.
|
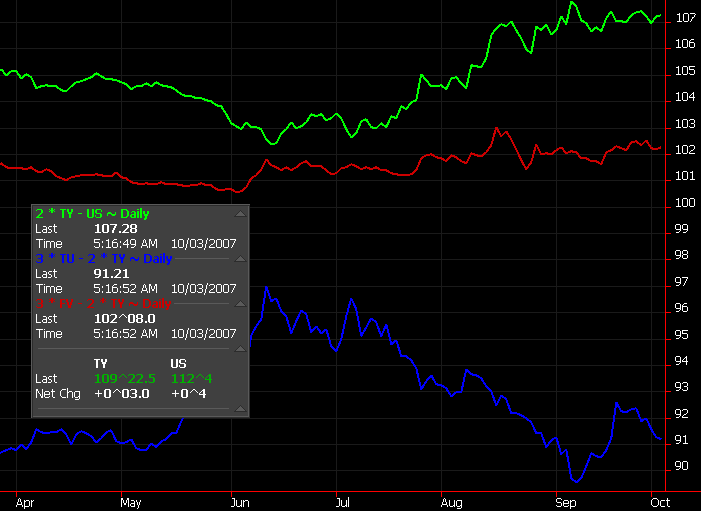
In the example below there are represented three spread charts: 2 * TY - US, 3 * FV - 2 * TY, 3 * TU - 2 * TY.
|
 Reload
This will require the server for redraw the spread chart.
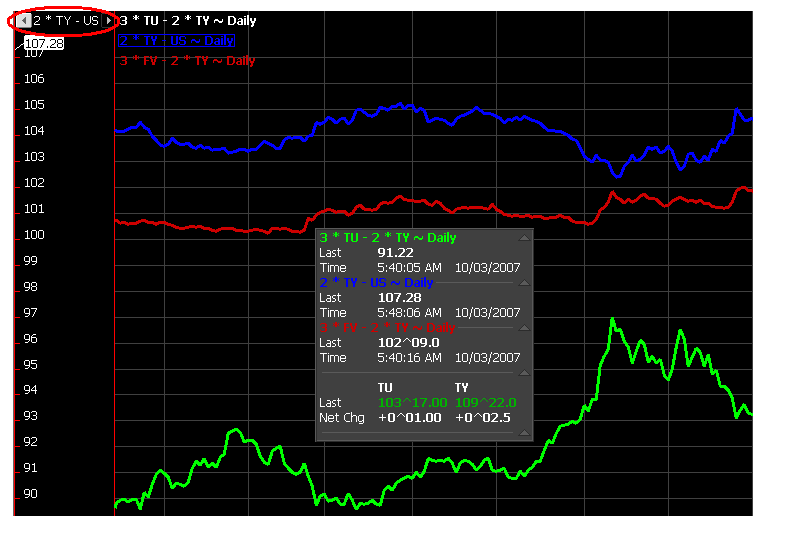
 Swap primary with overlay
This option switches the primary chart with the main overlay chart. The "main overlay" concept was introduced along with the possibility of adding a big number of overlay charts. By default, the main overlay is the most recent overlay chart added. The user can change the main overlay using the scrolls on the top of the left values scale (see the figure below). If you press the "Swap primary with overlay" button the chart represented above will be:
|
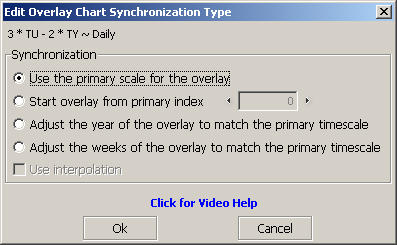
 Edit Overlay Synchronization
Describes the overlaying algorithms. If this button is pressed the "Edit Overlay Chart Synchronization Type" dialog appears.
In this dialog box, if the first option ("Use the primary scale for the overlay") is selected, the overlay chart and the primary chart share the same timescale. The "Start overlay from primary index" displays the overlay charts points starting at a certain index on the primary chart points vector. The third option ("Adjust the year of the overlay to match the primary timescale") overlay a chart matching: day/month of both charts points. For E.g. primary chart ECM7 and overlay ECM5, then if primary point is 6/24/2007 the overlay point will be 6/24/2005. The last option is "Adjust the weeks of the overlay to match the primary timescale" match the trading weeks of both contracts.
You can "Use interpolation" whether you select "Adjust the year of the overlay to match the primary timescale" or "Adjust the weeks of the overlay to match the primary timescale".
|
 Indicators
An indicator is a mathematical formula that can be applied to chart data. The result is a value that is used to anticipate future changes in prices.
See How to work with indicators
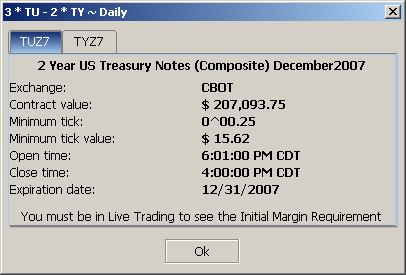
 Contract Details
This will open a dialog that contains details for the current contract(s) (see the figure below).
|
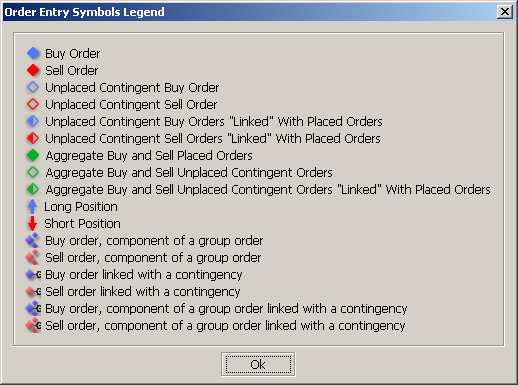
 Order Entry Legend
This will open a dialog with the legend for the symbols used in order entry.
|
 Decrease gap
This will decrease the distance between two chart points. If you had changed the bars or candles from large to small, the distance between two points remains the same. For the small bars or candles you can decrease much more the distance between the two points. So you can press "Decrease gap" button to decrease that distance (the gap).
 Increase gap
This will increase the distance between two chart points.
 Best fit
This option makes the best fit between two chart points.
 Decrease font
This will decrease the size of fonts that are used in "Spread Charts". The dimension of rows will be also modified according to the new font size.
 Increase font
This will increase the size of fonts that are used in "Spread Charts". The dimension of rows will be also modified according to the new font size.
 Snap Mode
Snapping mode is active when a line is drawn.
See a detailed presentation of using Snap Mode
 Switch mode
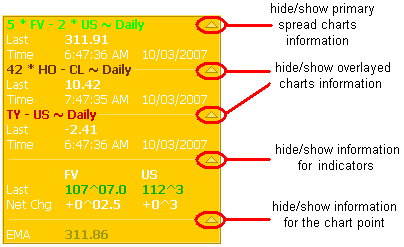
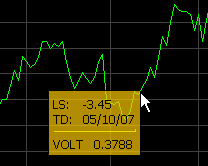
The data for a chart point can be visualized as different labels placed on the chart or in an "info box" as it's shown below in the pictures. The advantage of using "info box" is that it can be moved anywhere on the chart by drag-and-drop. The "info box" has three sections:
|
- one or more for hide/show primary and overlayed charts information. In the example below we have a primary and one
overlayed chart.
- one for hide/show information for indicators. - one used to hide/show information for the chart point. |
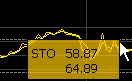
This sections are represented in the first figure below. The second pictures represents an info box which has one of this buttons pressed.
|
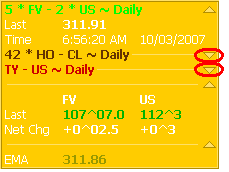
|
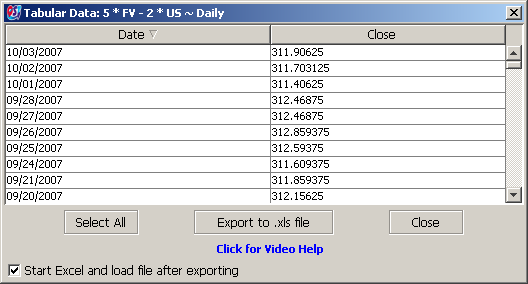
 Tabular Data
If this button is pressed the "Tabular Data" dialog will appears (see the figure below). From this dialog you can select the data you need (you can use the "Select All" button for selecting all the data from the table) and export to an Excel file by pressing the "Export to .xls file" button.
|
 Toggle Tooltip
This feature enables a tooltip to appear when the mouse is over the chart or over an indicator. The tooltip will show you all information about the session where the mouse is positioned.
|
|
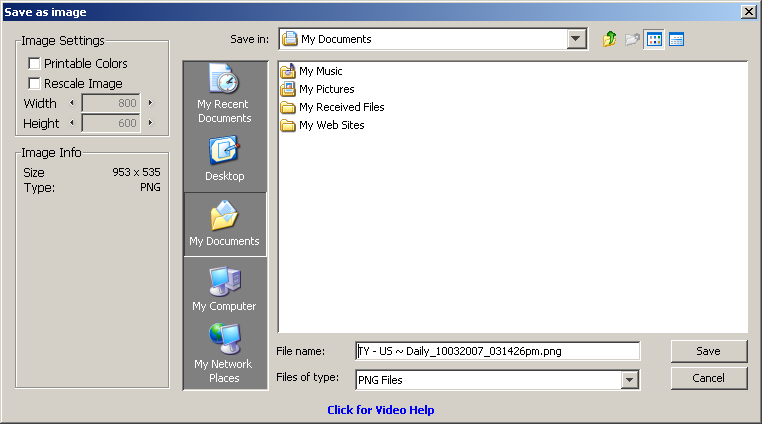
 Save as image
The chart can be saved as JPEG or PNG image. If you don't write the extension of file: ".jpg", ".jpeg" or ".png"; this will be set as default: ".jpg" or ".png" according to the file type.
|
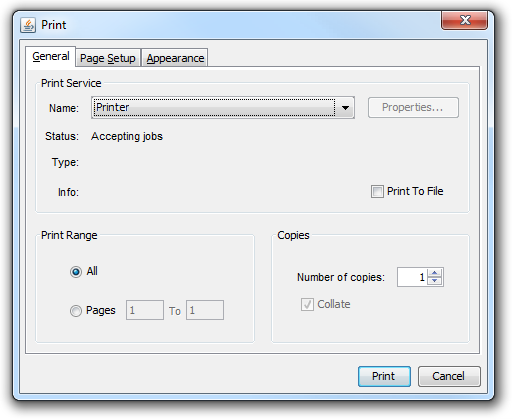
 Print
Print
This will open a dialog with three tabs.
From "General" you can set the print service, the print range and the number of copies you want to make.
|
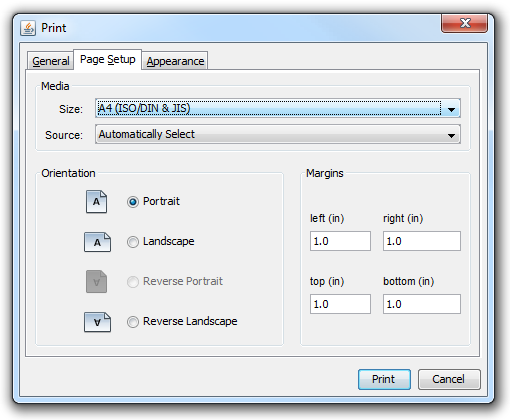
From "Page Setup" you can set the media, the orientation and the margins of the page.
|
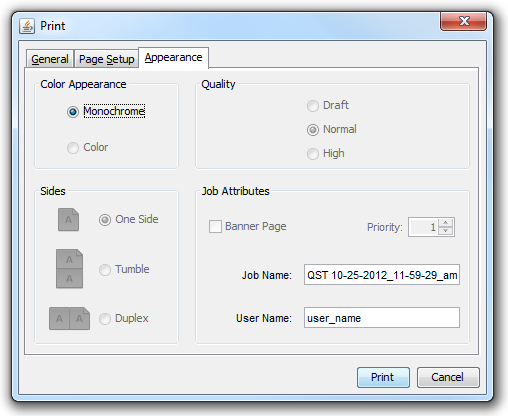
From "Appearance" you can choose the color and the quality of the printing.
|
 Video Help
This will open a web browser and gives you video instructions about "Spread Charts" module.
 Help
Help
It opens the Help for "Spread Charts" module.
 Properties
See the Spread Charts Properties
