Change height of the study areas
Starting with version 1.1.7. the little divider in between any study areas or between a study area and the chart area is sensitive to the mouse dragging feature. Simply hover on top of that line and you'll see the cursor change to a vertical arrowed line, then click and drag the line up or down to adjust the size of that area accordingly.
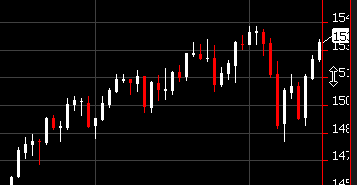
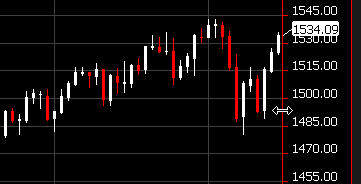
Change width of the values scale
The values scale width can be changed by dragging. The font used in chart will change it's size according to values scale width. For a small width of values scale - small fonts, for a bigger width of values scale - bigger fonts.
|
|
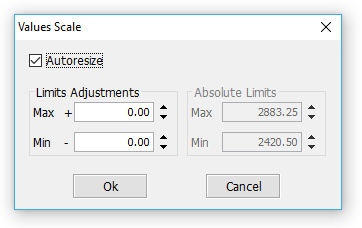
Values Scale dialog
Starting with version 1.1.7. by double click on the values scale you open the "Values Scale" dialog. By disabling "Auto resize" you can change the minimum and maximum value for the scale. If "Auto resize" is selected, the scale will change it's size so the chart data will fit in graphic.
|
|
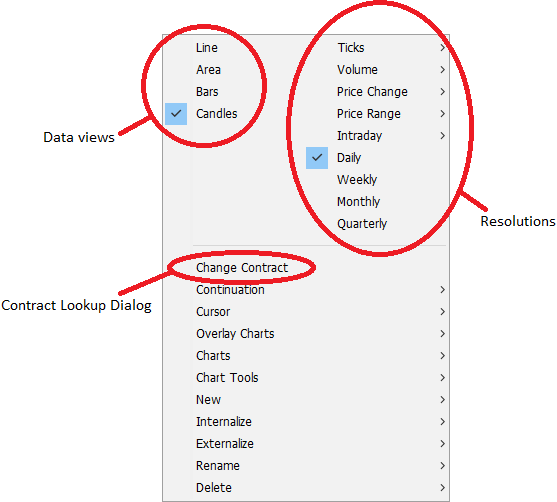
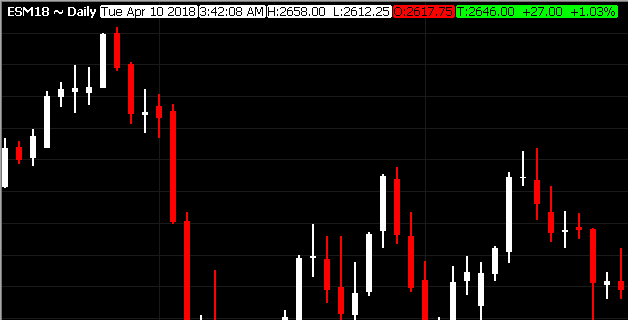
The chart area contains a region of the chart or the entire chart if the chart goes in the chart area. The chart data can be shown with different data views. The data views used in this module are: Line, Area, Bars and Candles. You can change the current data view directly from the chart using the right click on the chart area. This will open a box from where you can choose a data view as it's shown in the picture on the right. The resolution can also be changed by choosing a resolution from the "Resolutions" section. You have seven options for this: Ticks, Volume, Intraday, Daily, Weekly, Monthly and Quarterly. You can even change the chart to another contract by choosing Change Contract. |
|
|
By hovering with the mouse over the chart, a popup will appear showing you information about that session. The same functionality is available for indicators. |
|
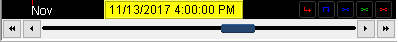
You can move from one region of the chart to another using scrollbar. While scrolling it is very useful to have some information about the time (to know what you will see when you reach there), because of that we use a tool tip that shows the time as is shown in the figure below.
The tool tip is shown when you move the mouse cursor over the scrollbar or when you scroll.
|
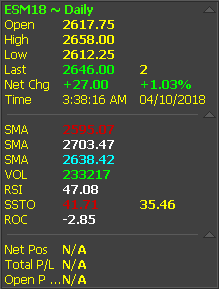
Double click on an item from the status bar will open the properties dialog for that item. Double click on the "Lines (CL)" will open the Lines Properties dialog. Double click on "Area (CL)" will open the Area Properties dialog. Double click on "Bars" will open the Bars Properties dialog, and on the "Candles", the Candles Properties dialog.


|
|
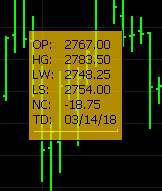
The "info box" is an alternative for labels (see the figure from the right). The advantage of the "info box" is that it can be moved anywhere on the chart by simply drag-and-drop to another location. The info box can also be minimized. Each section of the info box has in the top of it a button
( To switch from info box to labels (see the figure below) and reversal use "Switch mode"
button |
|
|

 ) from where you can make the section visible again.
 from the toolbar.